A study showed that in Okayama Prefecture, 42 out of 452 (9.3%) patients diagnosed with Kawasaki disease (KD), had elevated antibody titers for Yersinia pseudotuberculosis (YPT) and/or positive stool culture (YPT-positive group). The onset age in the YPT-positive group (3.05±2.20 y) was significantly higher than that in the YPT-negative group (2.31±2.05 y) (p=0.03). The age-adjusted statistical analysis demonstrated that the incidence of coronary artery lesions (dilatations plus aneurysms) in the YPT-positive group (22/42, 52.4%) was significantly higher than that in the YPT-negative group (105/330, 31.8%) (p=0.01), and the incidence of re-administration of immunoglobulin (re-IVIG) in the YPT-positive group (13/36, 36.1%) was significantly higher than in the YPT-negative group (41/256, 16.0%) (p=0.004).1) In another study conducted in Hyogo Prefecture, 11 patients (10%) were positive for anti-YPT and/or anti-YPT-derived mitogen antibodies (positive group) and 97 (90%) were negative (negative group). Cardiac sequelae occurred significantly more frequently in the positive than the negative group (2 patients, 18% vs 1 patient, 1%, p=0.0027). The onset age in the positive group was not significantly higher than that in the negative group (mean age: 29 m vs 24 m, p=0.26).2)
There has been no report of the prevalence of YPT infection among KD patients outside Okayama and Hyogo. Some believe that YPT infection is eccentrically localized in some parts of the Seto Inland Sea coast.
The purpose of this study was to address the following issues:
1. While the regional differences in the prevalence of KD have already been reported, no study has examined regional differences in the age distribution, incidence of re-IVIG, and prevalence of coronary artery aneurysms (CAA).
2. If YPT infection is only distributed in a limited area, the onset age of KD in that area may be high, and re-IVIG and CAA may occur more frequently.
Of a total of 208,907 KD cases reported in the 16th to 24th National Survey of KD (1999–2016), 208,757 cases reported from the affected prefectures with available data on the age of onset of KD were included in this study.
This study was conducted with the data from the nationwide survey of KD, with the assistance of Prof. Yoshikazu Nakamura, Jichi Medical University.
1. First, we analyzed data from 47 prefectures over 18 years. Next, the cases were divided into 8 groups according to the region of residence, and the analysis was performed separately for three periods: 1999–2004, 2005–2010, and 2011–2016. Finally, a full-term (18 years) analysis was conducted for the 8 regions.
2. The 8 regions were as follows: region-1: Hokkaido/Tohoku (prefecture code number in Japan: 1, 2, 3, 4, 5, 6, and 7), region-2: Kanto (8, 9, 10, 11, and 12), region-3: Tokyo/Kanagawa (13 and 14), region-4: Chubu (15, 16, 17, 18, 19, 20, 21, 22, and 23), region-5: Kinki (24, 25, 26, 27, 29, and 30), region-6: prefectures from which YPT infection with KD symptoms was reported (28 and 33), region-7: Chugoku/Shikoku (31, 32, 34, 35, 36, 37, 38, and 39), region-8: Kyushu/Okinawa (40, 41, 42, 43, 44, 45, 46, and 47). In addition, the same analysis was conducted after adding Hiroshima to region-6 (28, 33, and 34). We initially planned to have the following regions: Hokkaido, Tohoku, Kanto, Chubu, Kansai, Chugoku, Shikoku, and Kyushu/Okinawa. However, we put Okayama and Hyogo together into one region, and, since the Kanto region had too many patients in one region, divided it into two parts, Tokyo/Kanagawa, where population density was higher, and defined the rest of the Kanto region as Kanto region for convenience. In addition, since Hokkaido alone had only a small number of patients, we combined it with the neighboring Tohoku region for the Hokkaido/Tohoku region. Similarly, since Chugoku and Shikoku alone had a small number of patients, they were combined into Chugoku/Shikoku region.
3. The following analyses were conducted:
Analysis of onset age distribution.
The mean and median age (in days) of onset and the proportion of patients aged <1 year and/or ≥1 year in 8 regions were compared by the Kruskal–Wallis and chi-square tests with Bonferroni correction.
The age of onset was categorized into 19 groups in month to determine the diversity of age distribution across 8 regions. The 19 groups were: 0–2, 3–5, 6–8, 9–11, 12–14, 15–17, 18–20, 21–23, 24–29, 30–35, 36–41, 42–47, 48–59, 60–71, 72–83, 84–95, 96–107, 108–119, and ≥120 months. The difference in the distribution of the 19 age groups was compared between each region and the other 7 regions by the chi-square test.
The re-IVIG rate for patients treated with IVIG was analyzed by the chi-square test.
CAA was divided into acute (within one month after onset) and chronic (persisting for more than one month after onset) cases, and the prevalence of each type of CAA were compared by the chi-square test.
All significant differences (p values) mentioned in this report were adjusted for multiple comparisons with Bonferroni correction.
The statistical software used in this study was SPSS (IBM) and Microsoft Excel add-in software (SSRI).
1. In the analysis of onset age in 47 prefectures over an 18-year period, the mean value ranged from 738 to 989 days, and the median from 548.5 to 840 days. Seven out of the eight prefectures in region-8 (Kyushu/Okinawa) were included in the 15 areas with the lowest onset age. On the other hand, 5 out of the 5 prefectures in region-3 (Kanto) were included in the 15 areas with the highest onset age. Re-IVIG rate ranged from 10.5% to 24.2%. The prevalence of acute and chronic CAA ranged from 0.8% to 3.7% and from 0.4% to 2.6%, respectively. Five out of the 7 prefectures in region-1 (Hokkaido and Tohoku), and 6 out of the 8 prefectures in region-8 (Kyushu/Okinawa) were included in the 15 areas with the highest prevalence of CAA. A significant variation was observed in the number of patients across prefectures, ranging from a minimum of 748 to a maximum of 21,497, probably due to uneven distribution of the population, during the 18-year period.
2. When the data from 8 regions were analyzed separately for 3 periods, many findings were observed over time, but some of them were already known findings.3–5) Specifically, over time, the number of patients mean and median age, proportion of patients aged ≥1 year and re-IVIG rate increased while the prevalence of CAA decreased.
3. When the data from 8 regions were analyzed over the entire18 year period, the mean and median ages of KD onset were significantly different among 8 regions (p<0.001). Region-2 had the highest mean and median ages, and region-8 had the lowest. In pairwise comparisons between region-6 and other regions, the onset age in region-6 was lower than that in region 2 (p<0.05) and higher than that in region-8 (p<0.001), with no significant differences as compared to the other regions (region-1, 3, 4, 5, and 7).
The proportion of patients aged ≥1 year was also significantly higher in region-2 (p<0.05) and significantly lower in region-8 (p<0.001) compared to region-6.
Re-IVIG rate was lower in region-1, 2, 3 (each p<0.001) and 5 (p<0.01) compared to region-6.
The prevalence of CAA was higher in region-1 for both acute (p<0.01) and chronic cases (p<0.001) compared to region-6 (Table 1).
Table 1 Charastaristics of patients with Kawasaki disease in 8 regions | Mean onset age (day) | Median onset age (day) | ≥1 y. (%) | Re-IVIG† (%) | Acute phase CAA‡ (%) | Residual CAA (%) | n |
|---|
| Region-1 | 950.7 | 739.5 | 75.68 | 14.09*** | 2.08** | 1.60*** | 20,726 |
| Region-2 | 981.5* | 771.0* | 78.10* | 15.32*** | 1.45 | 1.12 | 33,930 |
| Region-3 | 951.6 | 749.5 | 76.15 | 15.29*** | 1.37 | 1.01 | 38,276 |
| Region-4 | 959.7 | 766.0 | 76.70 | 17.19 | 1.38 | 1.03 | 36,565 |
| Region-5 | 960.6 | 766.0 | 76.45 | 15.63** | 1.67 | 1.14 | 28,457 |
| Region-6 | 954.8 | 755.0 | 76.10 | 16.99 | 1.41 | 1.10 | 12,802 |
| Region-7 | 942.4 | 738.0 | 75.35 | 17.90 | 1.56 | 1.09 | 15,130 |
| Region-8 | 913.9*** | 716.0*** | 74.68*** | 18.11 | 1.89* | 1.40 | 22,871 |
| All regions | 954.4 | 753.0 | 76.14 | 16.16 | 1.61 | 1.19 | 208,757 |
| Region-1: Hokkaido/Tohoku, Region-2: Kanto, Region-3: Tokyo/Kanagawa, Region-4: Chubu, Region-5: Kinki, Region-6: Hyogo/Okayama, Region-7: Chugoku/Shikoku, Region-8: Kyushu/Okinawa. Re-IVIG†: re-administration of intra-venous immunoglobulin CAA‡: coronary artery aneurysm *: p<0.05, **: p<0.01, ***: p<0.001 (green: low values; red: high values) (significant differences between region-6 and other regions) |
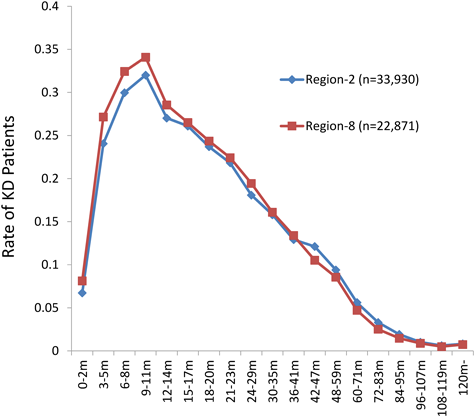
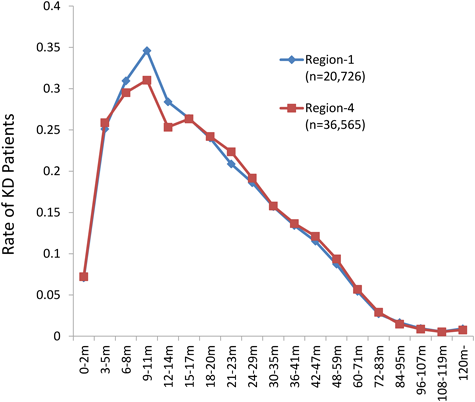
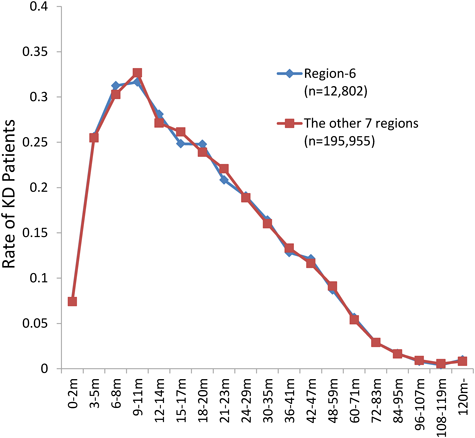
The same result was obtained when Hiroshima Prefecture-33 was added to region-6. The comparison of the distribution of the 19 onset age groups among regions showed many significant differences. In region-1, the proportion of 9–14 months was high and that of 21–23 months was low (each p<0.001). In region-2, the proportions of 0–5 and 24–29 months were low and that of 72–95 months was high (p<0.001). Region-3 was generally average. In region-4, the proportion of 9–14 months was low (p<0.001). Region-5 had a low proportion of 6–8 months and a high proportion of 30–35 months (p<0.001). Region-6 was generally average. Region-7 had a high proportion of 3–8 months (p<0.01). Region-8 had a high proportion of 0–14 months and low proportions of 42–47 and 60–71 months (p<0.001), (Table 2; Figs. 1–3).
Table 2 The rates of each onset age group in 8 regions| Age | 0–2 m | 3–5 m | 6–8 m | 9–11 m | 12–14 m | 15–17 m | 18–20 m | 21–23 m | 24–29 m |
|---|
| Region-1 | 0.0708 | 0.2511 | 0.3096 | 0.3460*** | 0.2841*** | 0.2640 | 0.2403 | 0.2088*** | 0.1860 |
| Region-2 | 0.0673*** | 0.2405*** | 0.2997 | 0.3201 | 0.2702 | 0.2609 | 0.2370 | 0.2182 | 0.1808*** |
| Region-3 | 0.0766 | 0.2500 | 0.2990 | 0.3325 | 0.2763 | 0.2623 | 0.2402 | 0.2244 | 0.1880 |
| Region-4 | 0.0722 | 0.2587 | 0.2953** | 0.3104*** | 0.2534*** | 0.2634 | 0.2422 | 0.2236 | 0.1917 |
| Region-5 | 0.0748 | 0.2567 | 0.2915*** | 0.3217 | 0.2692 | 0.2529 | 0.2331 | 0.2205 | 0.1913 |
| Region-6 | 0.0750 | 0.2562 | 0.3125 | 0.3165 | 0.2809 | 0.2484 | 0.2478 | 0.2084 | 0.1906 |
| Region-7 | 0.0793 | 0.2668** | 0.3159** | 0.3291 | 0.2681 | 0.2631 | 0.2361 | 0.2213 | 0.1922 |
| Region-8 | 0.0813*** | 0.2714*** | 0.3243*** | 0.3409*** | 0.2854*** | 0.2650 | 0.2436 | 0.2242 | 0.1944 |
| All regions | 0.0741 | 0.2549 | 0.3033 | 0.3262 | 0.2718 | 0.2606 | 0.2396 | 0.2199 | 0.1889 |
| 30–35 m | 36–41 m | 42–47 m | 48–59 m | 60–71 m | 72–83 m | 84–95 m | 96–107 m | 108–119 m | 120 m– |
|---|
| 0.1571 | 0.1342 | 0.1152 | 0.0874 | 0.0543 | 0.0273 | 0.0166 | 0.0095 | 0.0056 | 0.0093 |
| 0.1580 | 0.1292 | 0.1211 | 0.0940 | 0.0561 | 0.0331*** | 0.0193*** | 0.0102 | 0.0062 | 0.0082 |
| 0.1575 | 0.1318 | 0.1154 | 0.0921 | 0.0535 | 0.0297 | 0.0167 | 0.0085 | 0.0055 | 0.0074 |
| 0.1579 | 0.1367 | 0.1213 | 0.0938 | 0.0568 | 0.0292 | 0.0147 | 0.0087 | 0.0054 | 0.0078 |
| 0.1708*** | 0.1337 | 0.1173 | 0.0914 | 0.0538 | 0.0284 | 0.0161 | 0.0091 | 0.0055 | 0.0091 |
| 0.1640 | 0.1283 | 0.1214 | 0.0869 | 0.0566 | 0.0289 | 0.0169 | 0.0081 | 0.0043 | 0.0098 |
| 0.1589 | 0.1338 | 0.1104 | 0.0901 | 0.0527 | 0.0266 | 0.0143 | 0.0096 | 0.0053 | 0.0090 |
| 0.1609 | 0.1340 | 0.1053*** | 0.0856 | 0.0471*** | 0.0252** | 0.0146 | 0.0088 | 0.0050 | 0.0074 |
| 0.1603 | 0.1329 | 0.1165 | 0.0910 | 0.0541 | 0.0290 | 0.0163 | 0.0091 | 0.0055 | 0.0083 |
| **: p<0.01, ***: p<0.001 (green: low values; red: high values) |
Interpretation and Speculation of Regional Characteristics
Many regional differences were found in the comparison of the onset age, re-IVIG rate and CAA prevalence in KD patients, however, no significant relationship was found among them by multivariate analysis. It is unclear whether these differences are due to the nature of the disease itself, to interventions, or to the environmental factors surrounding patients.
Nevertheless, in region-1, 2, and 8, the onset age distribution, re-IVIG rate and prevalence of CAA showed characteristic patterns, and may require further explanation or interpretation.
In region-1, the re-IVIG rate tended to be low and CAA prevalence was high, suggesting the need to consider re-IVIG more aggressively.
In region-2, the onset age showed a characteristic distribution pattern and tended to be older, with a lower re-IVIG rate but lower prevalence of CAA. We cannot deny the existence of a regional factor that prevents the occurrence of CAA at an older age.
In region-8, the distribution of onset age showed the most characteristic pattern and tended to be younger, with a higher re-IVIG rate and higher prevalence of CAA. It cannot be denied that there is a regional factor that promotes the occurrence of CAA at a young age.
In region-6 (Okayama and Hyogo), where patients with YPT infection were reported, all analyses yielded average results. These findings suggest that YPT infection is not be eccentrically localized along the Seto Inland Sea coast.
YPT Infection
In Japan, outbreaks have been reported twice from Hiroshima and four times from Okayama after 1977. Outbreaks have also been reported from Mie, Gifu, Wakayama, Shimane, Niigata, Chiba, Nagano, and Aomori.6, 7) With an unclear nationwide distribution of sporadic cases, this infection may be distributed throughout Japan, rather than being confined to specific area. The co-existence of YPT infection with KD symptoms was first reported in 1983,8, 9) and once attracted attention as evidence supporting the KD super-antigen theory.10, 11) However, it is now attracting attention from a different point of view, as to whether it is a risk factor for refractory IVIG or CAA.1, 2) We now believe that YPT infection is a trigger factor for KD.12, 13)
Diagnosis of YPT Infection
A diagnostic test for YPT infection has recently become available in routine practice, with the use of the Loop-Mediated Isothermal Amplification (LAMP) method, which provides rapid results compared to antibody testing. The LAMP method may be one of the essential tests for daily medical care of KD patients.2, 14, 15)
Problems and Limitations of This Study
The age distribution of a single disease, such as measles or pertussis, has been found to vary from region to region.16) Many factors are thought to be involved, such as prevalence, population density, age composition, hygiene status, nutrition status, or extent of immunity acquisition, but the details are not yet fully understood. Therefore, a clear explanation may not be possible even if significant changes are observed.
It is unclear how often YPT infection is checked in daily practice of KD nationwide and whether or not each hospital reports cases of YPT infection with KD symptoms as KD cases. If YPT infection is considered to be a triggering factor for KD, it should be reported as a KD case. If YPT infection with KD symptoms is recognized as a different disease entity, it may not be reported as a KD case. However, given that all such cases are treated as KD in actual practice, the epidemiological survey results are unlikely to be biased.
The details of the KD treatment protocols used in each region, including the timing of re-IVIG, are unknown. The detailed population structure of each region is also unknown, which should be reflected in the age distribution of KD in each region and each age category.
Currently, the nationwide incidence of YPT infections is unknown. Therefore, there is no way to know how YPT infection actually affects the age distribution of KD in each region. There are occasional reports of YPT outbreaks from various places in Japan; however, the regional and temporal incidences of sporadic cases are completely unknown. There have been only two reports from Okayama and Hyogo regarding the incidence of YPT infection with KD as mentioned above. Its nationwide incidence over time is also completely unknown. The reports from Okayama and Hyogo covered cases reported between 1985 and 2004 and between 2013 and 2014, respectively. Our analysis in this study involved cases reported between 1999 and 2016; therefore the onset times of the target cases were different between the two previous reports and ours. We performed this analysis assuming a constant prevalence of YPT infection in each region over time, based on the simple idea that there may be regional differences in the age distribution of KD if there are regional differences in the prevalence of YPT infection. Therefore, there were many statistical biases in our analysis. In the near future, once data are available on the nationwide incidence of YPT infections with KD, it will be possible to accurately analyze the effect of YPT infections on the age distribution of KD.
There were regional variations in onset age of KD, re-IVIG rate, and CAA prevalence. However, in region-6, where patients with YPT infection were reported, all analyses yielded average results. The nationwide frequency of YPT infection and the association between KD and YPT are desirable to be investigated. The LAMP method may be necessary for detecting YPT infection in KD patients in daily clinical practice.
謝辞Acknowledgments
We thank Professor Yoshikazu Nakamura in the Department of Public Health, Jichi Medical University, for providing us with these data. We are also very grateful to all the many others who cooperated with the nationwide survey of KD.
Conflicts of Interest
The authors declare no conflict of interest.
Ethical Statement
This study was in accordance with ethical standard of our institute.
Author Contributions
Y. T. designed and directed the study, and wrote the manuscript. T. F. critically reviewed the manuscript, gave technical support and supervised the whole study process. Y. Y., A. M., R. I., and M. S. critically reviewed the manuscript and gave technical support and conceptual advice. All authors read and approved the final manuscript.
引用文献References
1) Tahara M, Baba K, Waki K, et al: Analysis of Kawasaki disease showing elevated antibody titers of Yerusinis pseudotuberculosis. Acta Paediatr 2006; 95: 1661–1664
2) Horinouchi T, Nozu K, Hamahira K, et al: Yerusinia pseudotuberculosis infection in Kawasaki disease and its clinical characteristics. BMC Pediatr 2015; 15: 177
3) Nakamura Y, Yashiro M, Uehara R, et al: Monthly observation of the number of Kawasaki disease and its incidence rates in Japan: Chronological and geographical observation from the nationwide surveys. J Epidemiol 2008; 18: 273–279
4) Nakamura Y, Yashiro M, Uehara R, et al: Epidemiologic features of Kawasaki disease in Japan: Results of the 2009–2010 nationwide survey. J Epidemiol 2012; 22: 216–221
5) Tomita Y, Shimaya M, Yamaura Y, et al: Kawasaki disease: Epidemiological differences between past and recent periods, and implications of distribution dynamism. Pediatr Int 2018; 60: 349–356
6) Hayashidani H: Yersinosis. Jpn J Food Microbiol 2016; 33: 175–181 (in Japanese)
7) Takeda N: Various symptoms and complications of Yersinia infection. J Pediatr Infect Dis Immunol 2017; 1: 67–72 (in Japanese)
8) Sato K, Ouchi K, Taki M: Yersinia pseudotuberculosis infection in children, resembling Izumi fever and Kawasaki syndrome. Pediatr Infect Dis J 1983; 2: 123–126
9) Baba K, Takeda N, Tanaka M: Cases of Yersinia pseudotuberculosis infection having diagnostic criteria of Kawasaki disease. Contrib Microbiol Immunol 1991; 12: 292–296
10) Abe J, Takeda T, Watanabe Y, et al: Evidence for superantigen production by Yersinia pseudotuberculosis. J Immunol 1993; 151: 4183–4188
11) Abe J, Onimaru M, Matsumoto S, et al: Clinical role for a superantigen in Yersinia pseudotuberculosis infection. Clin Invest 1997; 99: 1823–1830
12) Tomita Y, Hirota A, Usami I, et al: Kawasaki disease arises from the temporary dysbiosis of young children during the development of gut immune defense Mechanisms. Prog Med 2010; 30: 1831–1837 (in Japanese)
13) Tomita Y, Fukaya T, Yamaura Y, et al: Implications of hepatic dysfunction in Kawasaki disease: Time-related changes in aspartate aminotransferase, alanine aminotransferase, total bilirubin, and C-reactive protein levels. Pediatr Invest 2019; 3: 19–26
14) Notomi T, Okayama H, Masubuchi H, et al: Loop-mediated isothermal amplification of DNA. Nucleic Acids Res 2000; 28: e63
15) Sakai N, Ohtsuka Y, Oka M, et al: A case of Yerusinia pseudotuberculosis infection with renal failure: The LAMP method was helpful to make the diagnosis. Jpn J Pediatr Nephrol 2010; 23: 102–106 (in Japanese)
16) Yanagawa H: Brief overview of 1st to 16th nationwide surveys of Kawasaki disease. In Yanagawa H, Nakamura Y, Yashiro M, eds. Epidemiology of Kawasaki Disease: A 30-Years Achievement. Tokyo: Shindan-To-Chiryousha Co., Ltd. 2002, pp 97–99 (in Japanese)
 ,Takashi Fukaya,Yasuko Yamaura,Atsuko Muratani,Rie Ikeuchi,Maki ShimayaYasuhiko Tomita