To accurately understand the pathology of congenital heart disease (CHD), several parameters need to be used. Ventricular volume is especially essential for understanding the disease accurately and predicting the patient’s prognosis. Since ventricular volume can serve as one of the determinants of surgical intervention, accurate measurement is vitally important. Cardiac catheterization (Cath), computed tomography (CT), and magnetic resonance imaging (MRI) have been used to evaluate the ventricular volume of patients with CHD. These reference values were measured in the 1970s using a cast that was created from a necropsied body; the same measurements have been used for many years.1–5) However, to the best of our knowledge, few reports have compared the accuracy of Cath, CT, and MRI in measuring ventricular volume. Based on the current standards of these measurement methods, it is unknown how accurately ventricular volume can be measured. Therefore, we prepared four different models of CHD using a 3D printer; measured the ventricular volume of each model using Cath, CT, and MRI; and compared the accuracy of the measured value of each modality.
Commercially available 3D cardiac models of CHD (one for atrial septal defect [ASD], one for ventricular septal defect [VSD], and one for tetralogy of Fallot [TOF]) were used for this study. The model was made by the Cross Medical Corporation (Kyoto, Japan) based on CT images of children with ASD, VSD, and TOF. The CT images were further reconstructed into a 3D model by the CrossMedical Corporation. Then, a 3D cardiac model was created with soft urethane, using stereolithography and the vacuum casting technique. The cardiac phase of the 3D model was the end-diastolic phase.
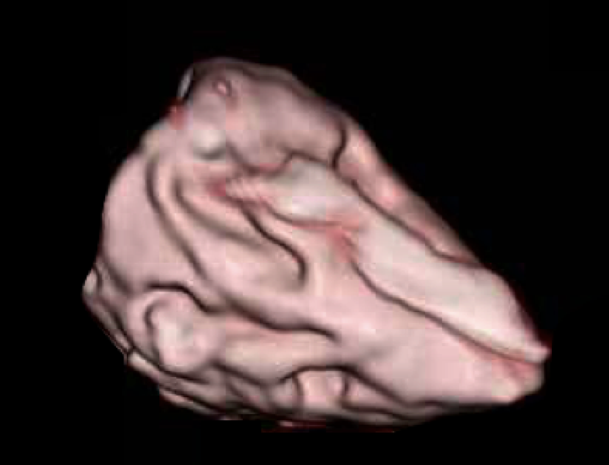
A 3D cardiac model of the single left ventricle (SLV) was specifically prepared based on the CT images of a patient who underwent Fontan surgery (Fig. 1). The patient was a 3-year-old boy with SLV, VSD, and coarctation of the aorta after undergoing the Fontan procedure. He was followed up at our hospital. We utilized digital data of a contrast CT examination that was performed at our hospital to create a 3D model of his heart. Informed consent for using the data was obtained from the patient’s parents.
To accurately measure the ventricular volumes of each model (seven ventricles), the valves of each ventricle were closed with glue and VSD patch closure was performed. Then, a 10-fold diluted contrast medium was injected into each ventricle through the tube. A cardio-angiography apparatus was used to capture the contrast agent in each ventricle. The amount of the contrast medium that filled the ventricle was defined as the absolute volume. The ventricular volume was measured with Cath, CT, and MRI using the same liquid. Then, these measured values were compared with the absolute volume.
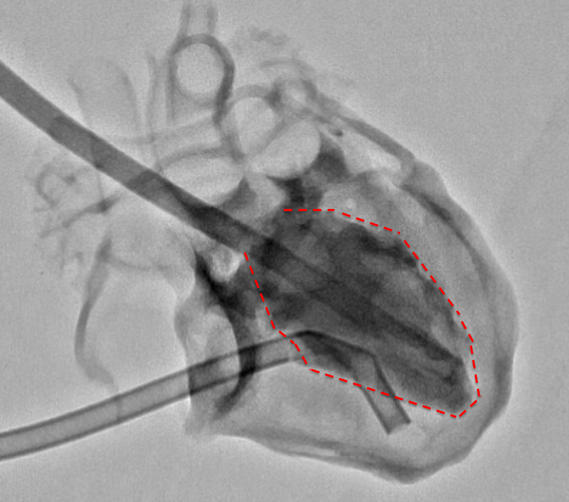
During Cath, ventricular imaging was performed from two directions: the postero-anterior and left lateral directions (Fig. 2a). Then, the ventricular volume was measured using Cardio Agent analysis software (Toshiba Medical Systems Corporation, Tochigi, Japan), where the left ventricular volume was measured using the area-length method and the right ventricular volume was measured using the Graham method. The images of the left and right ventricular chamber were traced in places where the shading is clear.
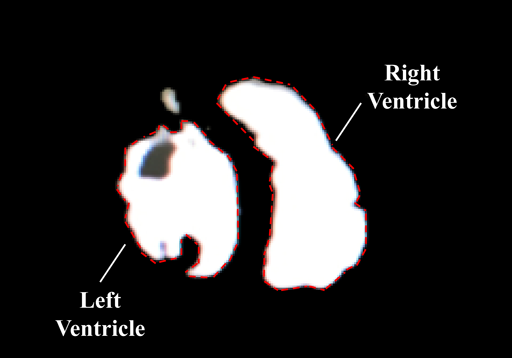
To measure the ventricular volume with CT, we used a CT device (GE Healthcare Japan Corporation, Tokyo, Japan). A 2.5-mm slice was taken to obtain the 3D constructed image (Fig. 2b). To reduce artifacts during the CT imaging, a 10-fold diluted contrast medium was used. The ventricular volume was computed using the CT analysis software VINCENT (Fujifilm Corporation, Tokyo, Japan). As a specific measurement method, the authors corrected all cross sections that were automatically traced in the ventricular lumen of the cardiac model, the cross-sectional area was automatically constructed in 3D, and the ventricular volume was measured.
To measure the ventricular volume with MRI, we used an MRI machine (1.5 Tesla, Philips Electronics Japan Corporation, Tokyo, Japan). A 3-mm slice was taken using the spin echo method. The image of an obtained short-axis cross section was measured using Ziostation MRI analysis software (Ziosoft Corporation, Tokyo, Japan), and the ventricular volume was measured (Fig. 2c). The specific measurement method was the same as that in CT.
All seven measurements were performed three times by the same observer, and the mean value was adopted as the measured volume. The measured volumes were also expressed as a percentage of their corresponding absolute volume. To ensure the reproducibility of our methods, we examined intraobserver and interobserver differences in the measured volumes. There was good correlation between intraobserver and interobserver values (r=0.991 and r=0.947, respectively).
The correction coefficient (k) was determined as follows: k=absolute volume÷measured volume. The average of seven different k values that were derived from the measurements of the volume of seven ventricles was designated as Kaverage. The corrected measured volume or corrected percentage was obtained as follows: the measured volume×the Kaverage or percentage of absolute volume×the Kaverage.
Each measured volume, which is expressed as the percentage of the absolute volume, was used to compare the accuracy among the three measuring methods. The differences among groups were assessed using two-tailed repeated ANOVA. Software was used for statistical analyses (ystat 2013; Igaku Tosho Press, Co. Ltd., Tokyo, Japan). Values of p<0.01 were inferred as significant. Post-hoc testing was conducted using a Dunnett test (two-tailed test).
Both the absolute volume and its corresponding measured volume that was obtained using the Cath, CT, and MRI methods are summarized in Table 1. The absolute volumes of the right ventricle for the ASD, VSD, and TOF models were 20, 10, and 35 mL, respectively. The absolute volume of the left ventricle was 7, 8.5, and 37 mL, respectively. The absolute volume of the SLV (as the left ventricular volume) was 15 mL.
Table 1 Absolute volume and measured volume of 4 different models | Absolute volume | Cardiac catheterization (Area length) | Cardiac catheterization (Graham) | CT | MRI |
|---|
| 1 | ASD RV (mL) | 20 | | 17.3±0.3 (86%) | 29.5±1.5 (147%) | 24.8±0.5 (128%) |
| 2 | ASD LV (mL) | 7 | 8.4±0.2 (121%) | | 9.8±1.5 (140%) | 8.2±0.0 (117%) |
| 3 | VSD RV (mL) | 10 | | 8.1±0.3 (81%) | 13.9±2.0 (139%) | 10.5±0.2 (105%) |
| 4 | VSD LV (mL) | 8.5 | 10.5±0.3 (124%) | | 11.3±1.2 (133%) | 9.3±0.3 (110%) |
| 5 | TOF RV (mL) | 35 | | 37.0±0.8 (106%) | 51.1±6.4 (146%) | 39.7±0.9 (114%) |
| 6 | TOF LV (mL) | 37 | 47.1±0.8 (127%) | | 47.2±1.0 (128%) | 38.7±0.3 (105%) |
| 7 | SLV (mL) | 15 | 16.7±0.5 (111%) | | 19.0±1.5 (126%) | 15.3±0.2 (102%) |
| All parameters are expressed as mean±SD. Parenthesis: measured volume was expressed as a percentage of absolute volume. ASD, atrial septal defects; VSD, ventricular septal defects; TOF, tetolalogy of Fallot; SLV, single left ventricles |
In the Cath method, the measured volumes of the right ventricle for the ASD, VSD, and TOF models were 17.3 (86%), 8.1 (81%), and 37 mL (106%), respectively. The measurements of the left ventricular volume were 8.4 (121%), 10.5 (124%), and 47.1 mL (127%), respectively. The measured volume of the SLV (as the left ventricular volume) was 16.7 mL (111%). The mean percentage and standard deviation of the ventricular volume that was measured using Cath was 94% (±11%).
In the CT method, the measured volume of the right ventricle in the ASD, VSD, and TOF models was 29.5 (147%), 13.9 (139%), and 51.1 mL (146%), respectively. The measurements of the left ventricular volume were 9.8 (140%), 11.3 (133%), and 47.2 mL (128%), respectively. The measured volume of the SLV (as the left ventricular volume) was 19.0 mL (126%). The mean percentage of the ventricular volume that was measured using CT was 137% (±8%).
In the MRI method, the measured volume of the right ventricle in the ASD, VSD, and TOF models was 24.8 (128%), 10.5 (105%), and 39.7 mL (114%), respectively. The measurements of the left ventricular volume were 8.2 (117%), 9.3 (110%), and 38.7 mL (105%), respectively. The measured volume of the SLV (as the left ventricular volume) was 15.3 mL (102%). The mean percentage of the ventricular volume that was measured with MRI was 111% (±8%).
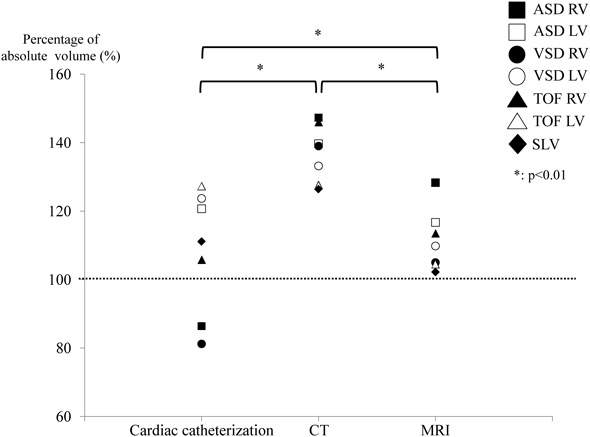
The values that were expressed as a percentage of the corresponding absolute volume were plotted on a graph (Fig. 3). There was a significant difference (p<0.01) among the three methods in the repeated ANOVA. The mean percentage of the Cath group was closest to 100%. However, regarding the data variability, the data of the Cath group appeared to be more widely distributed than the data of the CT or MRI group. All values of both CT and MRI groups were higher than 100%. Post hoc test showed that the value obtained using CT was significantly higher (p<0.01) compared to that obtained using Cath or MRI.
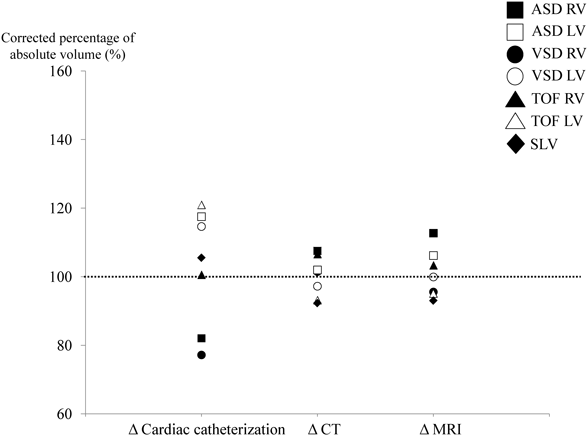
The Kaverage of the Cath, CT, and MRI groups was 0.95, 0.73, and 0.91, respectively. Based on the Kaverage, the corrected percentages were plotted on a graph (Fig. 4). As expected, there was no significant difference among the three groups. In addition, data obtained from CT or MRI were more accurate than those from Cath (Cath: 103% [±16%], CT: 100% [±6%], MRI: 101% [±7%]).
Using a cardiac model that was created with a 3D printer, we compared the absolute volume of the ventricle with the measured volume that was obtained with three different methods. In patients with CHD, expansion of the ventricular volume is often allowed due to valve regurgitation, especially in the remote postoperative period. When it is difficult to decide whether reoperation should be performed, the ventricular volume should be considered, as this enables the surgeon to arrive at a proper decision. Therefore, it is important to accurately measure the volume of the ventricle. Cath is the most common method for measuring ventricular volume, but it is an invasive method and can place a high burden on the patient if it is needed frequently. Therefore, CT and MRI are often used as substitute examinations for cardiac catheterization when evaluating the cardiac function and ventricular volume of patients with CHD. Patients with right ventricular volume overload due to pulmonary regurgitation after TOF repair in the remote postoperative period are often evaluated with MRI to determine the optimal time of pulmonary valve replacement.6) Although MRI has been regarded as the gold standard of ventricular volumetry for CHD patients, measurement with CT has also been carried out in recent years.7, 8) However, the extent to which the volume measured with CT or MRI deviates from the absolute volume has not been studied for very long, and few studies have addressed this issue. At present, the differences in the measurements using each modality do not have any clinical significance, but we believe that it is important to use accurate figures.
The ventricular volumes measured using CT and MRI were always higher than the absolute volumes. In addition, the measured volume of the CT group was significantly larger than the volumes of the Cath and MRI groups (p<0.01) (Fig. 3). This may be due to an artifact that was caused by the contrast medium. To prevent artifacts from appearing on CT images during the examination, we measured the ventricular volume using a diluted contrast medium. However, even the diluted contrast agent was insufficient to alleviate artifacts. Advances in imaging technology may resolve this problem in the future.
The ventricular volume that was measured using MRI was also larger than the absolute volumes. There are two reasons for this: 1) it is difficult to trace the cross-sectional area finely with MRI and 2) the volume of the papillary muscles was not excluded because of the limited performance of the analysis software that was used in this study. Therefore, the measured ventricular volume may be larger than the absolute volume. Recently, a technique that is capable of semi-automatically removing the papillary muscles and measuring the volume in a threshold-based segmentation algorithm has been introduced.9) As a result, ventricular volume measured using MRI is expected to further approximate the absolute volume.
On the other hand, the error variation of Cath in each model was larger than that for CT and MRI (Fig. 3). These values may have been derived from data that were obtained with a two-dimensional analysis. The complicated morphology of the cardiac model may make the measured volume more inaccurate. In the case of cardiac Cath, the ventricular volume varies, depending on the angle and direction of the heart in the existing calculation formulas. In contrast to Cath, both CT and MRI use data that are obtained by a 3D analysis. This may be one reason for the dispersion of error being smaller in CT and MRI than in Cath. In other words, the values that are close to the absolute volumes could be obtained by correcting measured values that were obtained using CT and MRI. Therefore, we measured the average value of the correction coefficient (Kaverage), produced the corrected measured value using Kaverage, and expressed them as the percentage of the absolute volume (Fig. 4). There were no significant differences among the groups. In addition, the error variation of CT and MRI were smaller than that of Cath. This indicated that the corrected measured volume that was obtained with both CT and MRI well reflected the absolute volume. Therefore, we concluded that CT or MRI could replace Cath for evaluating ventricular volume.
The limitation of this study is that the number of cardiac models was small. Second, the Kaverage was not reported for each modality. However, as we have shown in this study, it may be possible to calculate the correction coefficient by utilizing many cardiac models and study its feasibility. Third, in reality, cardiac motion has to be taken into account when measuring ventricular volume. Therefore, the volume should be measured using an ECG-gated method and respiratory-gated methods in CT or MRI. Fourth, all the cardiac models used in this study are created on the basis of CT images. Cardiac morphology, especially the inner surface of ventricles such as the chordae and trabeculations, may be more complicated than that of the cardiac models. Additional consideration is needed to determine whether similar results can be obtained with a large- or small-volume cardiac model.
We found that the variance of the measured volume of the ventricular volume was small for MRI and CT compared with that obtained using cardiac Cath. We believe that if the ventricular volume can be accurately measured noninvasively, the quality of management during the remote postoperative period will improve greatly. CT and MRI can replace cardiac Cath for measuring ventricular volume in patients with CHD.
Funding
This research did not receive specific grants from any funding agency, or commercial or non-profit entities.
Conflicts of Interest
The authors have no conflicts of interest.
Ethical Approval
All procedures performed in studies involving human participants were in accordance with the ethical standards of the institutional and/or national research committee and with the 1964 Helsinki declaration and its later amendments or comparable ethical standards.
引用文献References
1) Graham TP Jr., Jarmakani JM, Canent RV Jr., et al: Left heart volume estimation in infancy and childhood: Reevaluation of methodology and normal values. Circulation 1971; 43: 895–904
2) Graham TP Jr., Jarmakani JM, Atwood GF, et al: Right ventricular volume determinations in children: Normal values and observations with volume or pressure overload. Circulation 1973; 47: 144–153
3) Longmore DB, Klipstein RH, Underwood SR, et al: Dimensional accuracy of magnetic resonance in studies of the heart. Lancet 1985; 1: 1360–1362
4) Miller SW, Dinsmore RE, Wittenberg J, et al: Right and left ventricular volumes and wall measurements: Determination by computed tomography in arrested canine hearts. AJR Am J Roentgenol 1977; 129: 257–261
5) Lipton MJ, Hayashi TT, Boyd D, et al: Measurement of left ventricular cast volume by computed tomography. Radiology 1978; 127: 419–423
6) Geva T: Indications for pulmonary valve replacement in repaired tetralogy of fallot: The quest continues. Circulation 2013; 128: 1855–1857
7) Kim HJ, Mun DN, Goo HW, et al: Use of cardiac computed tomography for ventricular volumetry in late postoperative patients with tetralogy of Fallot. Korean J Thorac Cardiovasc Surg 2017; 50: 71–77
8) Koch K, Oellig F, Oberholzer K, et al: Assessment of right ventricular function by 16-detector-row CT: Comparison with magnetic resonance imaging. Eur Radiol 2005; 15: 312–318
9) Jaspers K, Freling HG, van Wijk K, et al: Improving the reproducibility of MR-derived left ventricular volume and function measurements with a semi-automatic threshold-based segmentation algorithm. Int J Cardiovasc Imaging 2013; 29: 617–623
 1,Masaya Sugimoto1,*1,Aya Kajihama1,Kouichi Nakau1,Sadahiro Nakagawa2,Hiroshi Azuma1Hideharu Oka