In our everyday clinical practices of pediatric cardiology, various clinical tests at rest, (e.g., chest X-ray, electrocardiogram, echocardiography, blood gas analysis, serum biochemical tests), are essential and indispensable for their evaluation. These tests can only observe, in a sense, physiological functions of the patients in an extraordinarily sedentary and unloaded circumstance; not at all their status during daily activities such as playing, exercising, standing, or sleeping. Therefore, appropriate evaluations of their physiological and cardiopulmonary responses to various stresses are essential in our clinical practices.
Cardiopulmonary exercise testing (CPET) is a test indispensable for the evaluation of functional reserve in subjects with cardiorespiratory diseases, predicting their prognosis, and effectiveness of treatment.1) Therefore, this review overviews the basics of measurements obtained from CPET sessions, that is, maximal oxygen uptake (V̇O2max), anaerobic threshold (AT), the minute ventilation (V̇E)-carbon dioxide output (V̇CO2) regression slope (V̇E/V̇CO2 slope), and the oxygen uptake efficiency slope (OUES), mainly in pediatric population.
What Does the V̇O2max Mean?
The V̇O2max shows the “maximal power output” of an examinee, which is determined comprehensively by the reserve functions of the circulatory system, respiratory system, and the skeletal muscles.2) This is one of the important and accurate prognostic indices of patients with heart failure.
When one mole of glucose is aerobically metabolized, a total of 6 moles of oxygen is used and 36 moles of adenosine triphosphate (ATP) is produced; namely, ATP is called as “currency of energy” which produces certain amount of energy (30.5 kJ/mol) when it is hydrolyzed to ADP. The proportional relationship addressed in this chemical formula tells us that measuring the amount of oxygen utilized in (or taken into) the body in a certain duration of time (usually per minute) is proportional to the amount of energy produced in the body during the period. In other words, this represents the work rate (power output) of the subject. Although we cannot directly measure the power produced by the body, we can do so indirectly by measuring the amount of oxygen taken into the body in a certain duration of time, that is, the oxygen uptake (V̇O2). Therefore, measuring the maximal amount of oxygen an examinee can take into the body per a unit of time (V̇O2max) is nothing other than indicating the maximal energy output the person can produce.
With the Fick’s law, VO2 is described as: where C.O. is cardiac output, and CaO2, CVO2, CPV and CPA, are oxygen contents in arterial, mixed venous, pulmonary venous, and pulmonary arterial blood, respectively. The C.O. indicates the function of the heart. The product CaO2–CVO2 represents efficiency of oxygen utility by the skeletal muscles, and the CPV–CPA the function of oxygen intake by the lungs. Thus, V̇O2max can be considered as an index of comprehensive reserves of cardiac, skeletal muscular, and respiratory functions. A normal value of V̇O2max for a male subject who does not regularly exercise is about 30–40 mL/min/kg, and the value is slightly lower in a woman.
Limitation of the V̇O2max
The V̇O2max is only a “conceptual gold standard”. Maximal exercise is often difficult and sometimes dangerous because it may lead to myocardial ischemia.3, 4) The physicians therefore have to compromise by using submaximal measurements. The most frequently used measurement in this respect is the peak V̇O2, the value at the end of incremental exercise testing. The following 3 indices do not need maximal exercise, either; namely, anaerobic threshold (AT), the slope of the minute ventilation (V̇E)/ carbon dioxide production (V̇CO2) regression, and the oxygen uptake efficiency slope (OUES).
AT and Ventilatory Threshold
Since the 1920s, the phenomenon that serum lactate concentration rises during strenuous exercise has been known. Lactate is produced in the working skeletal muscles. In the 1960s, Wasserman and coworkers hypothesized that the production of lactate was associated with the ischemia of the muscles above a certain level of exercise intensity. They named the phenomenon as AT.5) This hypothesis was so persuasive that many researchers and clinicians believed it. Then, researchers reported that the threshold can be determined non-invasively by analyzing expired gas during incremental exercise testing. This was named as ventilatory threshold (VT). These studies have made the AT the mainstream of the exercise physiology and exercise cardiology during the 1980s and 1990s. However, studies afterwards have proved that 1) any level of exercise intensity cannot cause ischemia of mitochondria of the skeletal muscle which leads to anaerobic energy production,6) 2) lactate is produced from the skeletal muscles at any level of exercise intensity,7–9) 3) the serum lactate levels are determined by the balance between its production and clearance,10, 11) and 4) accordingly, there is not any “threshold” of the serum lactate levels.12, 13) These studies have brought a tide of “abandon faith” for AT to most researchers today.
Although they believe that the AT theory that Wasserman advocated has been disproven, the AT is still widely used in our clinical practices. It is because AT represents the exercise intensity that is not too strenuous but not too mild, either. In fact, significant lactate accumulation in the blood does not occur under the exercise intensity below the AT levels. Cardiac ischemia hardly occurs below the AT levels; that is why exercise intensity at the AT level is often set for cardiac rehabilitation. Also, the AT is still widely utilized in the practices of athletic training, because appropriate training can suppress the blood level of lactate under the same exercise intensity. For example, Hurley and coauthors have shown that a 12-week exercise program elicited significantly lower lactate concentrations after training at the relative exercise intensities of the 55–75% of V̇O2max.14)
Usually, AT (VT) can be determined by the CPET.15) Most commonly, it is determined as the level of exercise intensity (or V̇O2) at which the ventilatory equivalent of the oxygen (V̇E/V̇O2) begins to increase during incremental exercise.15) Similarly, AT is the point at which the end-expiratory partial pressure of oxygen begins to increase,15) or the first point of departure from linearity of V̇CO2 plotted against V̇O2.16)
The V̇E/V̇CO2 Regression Slope
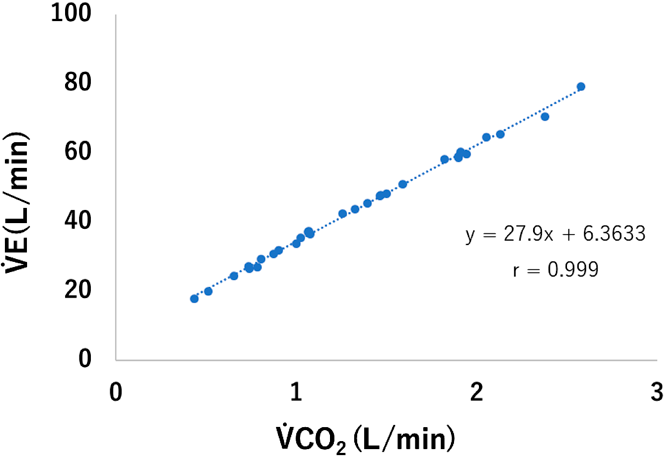
The alveolar ventilation equation concisely addresses the relation among the minute alveolar ventilation (V̇A), V̇CO2, and the arterial partial pressure of carbon dioxide (PaCO2), namely: When we replace V̇A with a more easily measurable parameter V̇E, this equation can be rewritten as: where Vd and Vt represent dead space ventilation and tidal volume, respectively.
We can consider that V̇E is expressed as a linear equation of V̇CO2, as PaCO2, Vd and Vt are relatively stable during exercise. In reality, the relation between V̇E and V̇CO2 during incremental exercise testing is linear from just before maximal exercise until the respiratory compensation point (Fig. 1). The slope of the regression equation shows the efficiency of ventilation during exercise. In patients with heart failure, pulmonary blood flow cannot distribute evenly to their alveoli, causing greater values of Vd, which leads to steeper linear relation between V̇E and V̇CO2. Therefore, the slope of the V̇E/V̇CO2 regression shows the ventilatory response to exercise. Also, there have been many studies that show the relation of the regression slope and the prognosis of patients with heart failure.17–19)
Oxygen Uptake Efficiency Slope
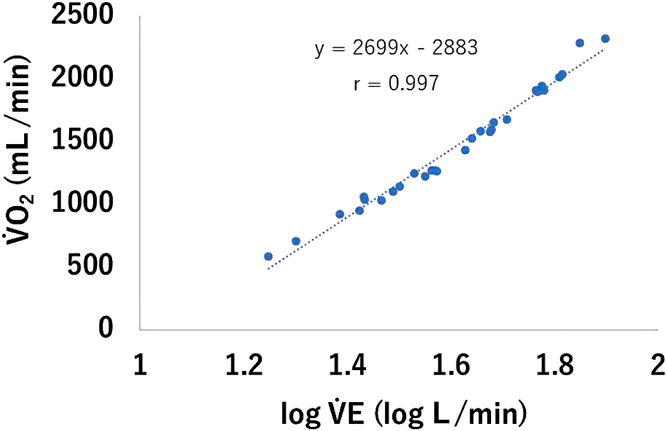
Fig. 2 shows the relation between V̇O2 and V̇E during incremental exercise. Note that the x-axis is logarithmically plotted. Therefore, their relation can be described as: where a and b are constants.
The relation can be observed with high values of regression coefficients regardless of subjects or exercise protocol.20) When the equation above is differentiated by V̇E on both sides:
This equation shows that the increment of V̇O2 against V̇E is determined by V̇E and the constant ‘a’ (1/ln10 ≈ 0.4343). Therefore, the constant ‘a’ indicates the rate of the increase in V̇O2 at a certain minute ventilation VE. We have named the slope ‘a’ as the oxygen uptake efficiency slope (OUES).20) The OUES is a measure of the ability to increase V̇O2 per 10-fold rise in minute ventilation. In other words, a steeper slope (or, a greater value of the OUES) shows that the subject can take oxygen into the body without excessively increasing ventilation, i.e., without causing shortness of breath.
One of the prominent features of the OUES is the fact that this index strongly correlates with V̇O2max.20–25) Another feature is that this can be accurately calculated without imposing maximal exercise on the examinee. The OUES is defined as the slope of the logarithmic relation between V̇O2 and V̇E during incremental exercise. This means that submaximal exercise data is theoretically sufficient for its calculation.20, 26) Also, the OUES can be used as prognostic indicators of patients with heart failure.27–31)
The clinical application of the OUES in the pediatric population has also been reported. Bongers and coauthors have provided sex- and age-related normative values for OUES which facilitates the interpretation of the OUES in children.32) Hossri and coauthors also have published reference values of the OUES and concluded that the OUES is a marker when differentiating preserved functional capacity from abnormal one in children and adolescents even at the submaximal level of exercise, regardless of with and without congenital heart disease.33) Recently, several studies have shown the prognostic values of the OUES in patients with congenital heart diseases. Chen and coauthors have reported that submaximal exercise parameters including the OUES provide superior prognostic information to maximal exercise data for predicting cardiac morbidity in patients with the Fontan circulation.34) The association between the OUES and cardiac morbidity was independent of relevant baseline clinical information.34) Moreover, Tsai and coauthors showed, in forty post-surgical patients with tetralogy of Fallot younger than 12 years old, that the OUES normalized by body surface area, as well as peak V̇O2, are useful predictors of cardiac-related hospitalization.35)
Conflicts of Interest
The author(s) declared no potential conflicts of interest with respect to the research, authorship, and/or publication of this article.
Editors’ Comments
Editor A) This article describes a basic idea of cardiopulmonary exercise testing, focusing on four parameters. These were comprehensibly explained from a mathematical, a physiological, or a historical aspect. The Editorial members do hope that this educational article could contribute to enhancement of basic knowledge in this field.
Editor B) While exercise testing has been hardly applied for kids, its importance in the CHD clinic is expanding with the increasing number of grown-up CHD patients. This short review written by R. Baba introduced very basic concept of exercise testing, and examples of its application for CHD patients. Although the learners must refer to a decent textbook to acquaint themselves with the cardiopulmonary exercise testing, we hope this article can evoke intellectual curiosity of the readers’ and may guide them where to start learning.
引用文献References
1) Mudge GH, Goldstein S, Addonizio LJ, et al: 4th Bethesda Conference Taskforce 3; Heart transplantation: Recipient guidelines/prioritization. J Am Coll Cardiol 1993; 22: 21–31
2) Mancini DM, Eisen H, Kussmaul W, et al: Value of peak exercise oxygen consumption for optimal timing of cardiac transplantation in ambulatory patients with heart failure. Circulation 1991; 83: 778–786
3) Myers J, Walsh D, Buchanan N, et al: Can maximal cardiopulmonary capacity be recognized by a plateau in oxygen uptake? Chest 1989; 96: 1312–1316
4) Rowland TW, Cunningham LN: Oxygen uptake plateau during maximal treadmill exercise in children. Chest 1992; 101: 485–489
5) Wasserman K, McIlroy MB: Detecting the threshold of anaerobic metabolism in cardiac patients during exercise. Am J Cardiol 1964; 14: 844–852
6) Jöbsis FF, Stainsby WN: Oxidation of NADH during contractions of circulated mammalian skeletal muscle. Respir Physiol 1968; 4: 292–300
7) Connett RJ, Gayeski TE, Honig CR: Lactate accumulation in fully aerobic, working, dog gracilis muscle. Am J Physiol 1984; 246: H120–H128
8) Hogan MC: Fall in intracellular PO2 at the onset of contractions in Xenopus single skeletal muscle fibers. J Appl Physiol 2001; 90: 1871–1876
9) Gladden LB: Muscle as a consumer of lactate. Med Sci Sports Exerc 2000; 32: 764–771
10) Donovan CM, Pagliassotti MJ: Quantitative assessment of pathways for lactate disposal in skeletal muscle fiber types. Med Sci Sports Exerc 2000; 32: 772–777
11) Brooks GA: Intra- and extra-cellular lactate shuttles. Med Sci Sports Exerc 2000; 32: 790–799
12) Myers J, Ashley E: Dangerous curves: A perspective on exercise, lactate, and the anaerobic threshold. Chest 1997; 111: 787–795
13) Yeh MP, Gardner RM, Adams TD, et al: “Anaerobic threshold”: Problems of determination and validation. J Appl Physiol 1983; 55: 1178–1186
14) Hurley BF, Hagberg JM, Allen WK, et al: Effect of training on blood lactate levels during submaximal exercise. J Appl Physiol 1984; 56: 1260–1264
15) Wasserman K, Whipp BJ, Koyl SN, et al: Anaerobic threshold and respiratory gas exchange during exercise. J Appl Physiol 1973; 35: 236–243
16) Beaver WL, Wasserman K, Whipp BJ: A new method for detecting anaerobic threshold by gas exchange. J Appl Physiol 1986; 60: 2020–2027
17) Chua TP, Ponikowski P, Harrington D, et al: Clinical correlates and prognostic significance of the ventilatory response to exercise in chronic heart failure. J Am Coll Cardiol 1997; 29: 1585–1590
18) Kleber FX, Vietzke G, Wernecke KD, et al: Impairment of ventilatory efficiency in heart failure: Prognostic impact. Circulation 2000; 101: 2803–2809
19) Buller NP, Poole-Wilson PA: Mechanism of the increased ventilatory response to exercise in patients with chronic heart failure. Br Heart J 1990; 63: 281–283
20) Baba R, Nagashima M, Goto M, et al: Oxygen uptake efficiency slope: A new index of cardiorespiratory functional reserve derived from the relation between oxygen uptake and minute ventilation during incremental exercise. J Am Coll Cardiol 1996; 28: 1567–1572
21) Baba R, Nagashima M, Goto M, et al: Oxygen intake efficiency slope: A new index of cardiorespiratory functional reserve derived from the relationship between oxygen consumption and minute ventilation during incremental exercise. Nagoya J Med Sci 1996; 59: 55–62
22) Marinov B, Mandadzhieva S, Kostianev S: Oxygen uptake efficiency slope in healthy 7 to 18 years old children. Pediatr Exerc Sci 2007; 19: 159–170
23) Marinov B, Kostianev S: Exercise performance and oxygen uptake efficiency slope in obese children performing standardized exercise. Acta Physiol Pharmacol Bulg 2003; 27: 59–64
24) Drinkard B, Roberts MD, Ranzenhofer LM, et al: Oxygen-uptake efficiency slope as a determinant of fitness in overweight adolescents. Med Sci Sports Exerc 2007; 39: 1811–1816
25) Baba R, Tsuyuki K, Kimura Y, et al: Oxygen uptake efficiency slope as a useful measure of cardiorespiratory functional reserve in adult cardiac patients. Eur J Appl Physiol Occup Physiol 1999; 80: 397–401
26) Akkerman M, van Brussel M, Bongers BC, et al: Oxygen uptake efficiency slope in healthy children. Pediatr Exerc Sci 2010; 22: 431–441
27) Davies LC, Wensel R, Georgiadou P, et al: Enhanced prognostic value from cardiopulmonary exercise testing in chronic heart failure by non-linear analysis: Oxygen uptake efficiency slope. Eur Heart J 2006; 27: 684–690
28) Arena R, Myers J, Abella J, et al: Prognostic significance of the oxygen uptake efficiency slope: Percentpredicted versus actual value. Am J Cardiol 2010; 105: 757–758
29) Myers J, Oliveira R, Dewey F, et al: Validation of a cardiopulmonary exercise test score in heart failure. Circ Heart Fail 2013; 6: 211–218
30) Coeckelberghs E, Buys R, Goetschalckx K, et al: Prognostic value of the oxygen uptake efficiency slope and other exercise variables in patients with coronary artery disease. Eur J Prev Cardiol 2016; 23: 237–244
31) Tang Y, Luo Q, Liu Z, et al: Oxygen uptake efficiency slope predicts poor outcome in patients with idiopathic pulmonary arterial hypertension. J Am Heart Assoc 2017; 30: e005037
32) Bongers BC, Hulzebos EH, Helbing WA, et al: Response profiles of oxygen uptake efficiency during exercise in healthy children. Eur J Prev Cardiol 2016; 23: 865–873
33) Hossri CA, Souza IPA, de Oliveira JS, et al: Assessment of oxygen-uptake efficiency slope in healthy children and children with heart disease: Generation of appropriate reference values for the OUES variable. Eur J Prev Cardiol 2019; 26: 177–184
34) Chen CA, Chen SY, Chiu HH, et al: Prognostic value of submaximal exercise data for cardiac morbidity in Fontan patients. Med Sci Sports Exerc 2014; 46: 10–15
35) Tsai YJ, Li MH, Tsai WJ, et al: Oxygen uptake efficiency slope and peak oxygen consumption predict prognosis in children with tetralogy of Fallot. Eur J Prev Cardiol 2016; 23: 1045–1050
 Reizo Baba