In the field of cardiovascular medicine, the right ventricle (RV) (the pulmonary ventricle responsible for the pulmonary circulation) has not been sufficiently assessed and analyzed compared with the left ventricle (LV) (responsible for the systemic circulation). On the other hand, the investigators are increasingly interested in RV function as a pulmonary chamber, and recognize it as important, because an ejection fraction (EF) of the RV is known to be related closely with prognosis in dilated cardiomyopathy1) and pulmonary hypertension.2) In congenital heart disease (CHD) such as tetralogy of Fallot, various conditions of heart defects reflect disorders in the RV. That is why the right heart system has attracted attention in this setting. Despite the recognition, there are many issues to elucidate regarding RV function.
The RV has three portions: the inlet, the trabecular, and the outlet portions. Usually, the RV is concavely configured by the convex LV, and assessing RV volume is not straightforward because of its complicated shape. In recent years, noninvasive modalities, such as magnetic resonance imaging (MRI), echocardiography, and computed tomography (CT), have made remarkable progress, and cardiac catheterization is indicated much less frequently.3) Still, use of cardiac catheterization remains important in the evaluation of RV function in CHD, since direct and accurate measurement of pressure is unique and informative (Fig. 1). This article outlines standard evaluation, detailed analysis and assessment, and also a perspective of cardiac catheterization in CHD.
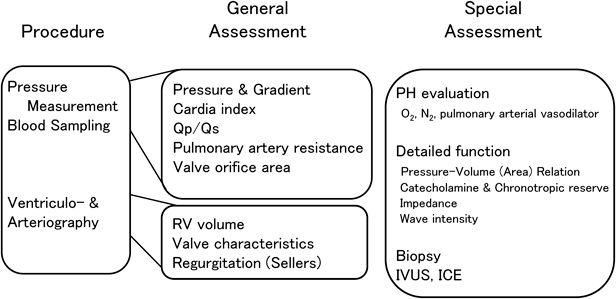
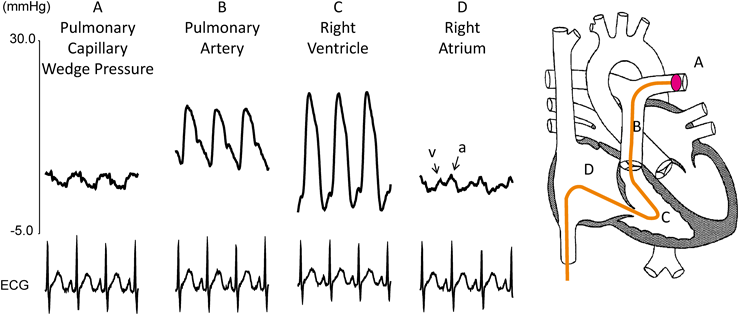
Generally, right heart catheterization for CHD (Fig. 1) consists of (1) pressure measurement and (2) oxygen saturation sampling at various locations, followed by (3) angiography. First, a catheter is inserted into the peripheral pulmonary artery (PA) (Fig. 2). A balloon is expanded to block blood flow there, and recorded is pulmonary capillary wedge pressure which reflects left atrial pressure. Pressure and oxygen saturation are then measured in the peripheral and central PA, while the catheter is withdrawn with pressure continuously recorded. A similar maneuver is carried out in the contralateral PA. Subsequently, pressure and oxygen saturation are measured at each site while pulling the catheter back further down to the RV and the right atrium. This process allows quantified assessment of pressure gradients (severity of stenosis), the amount of pulmonary blood flow, and pulmonary vascular resistance. Cardiac angiography is usually performed after these measurements completed. Right ventriculography is used to evaluate the RV volume, RVEF, the shape of the pulmonary valve, and tricuspid regurgitation. Pulmonary angiography can be used to evaluate configuration of the PAs and pulmonary regurgitation. Presence or absence of pulmonary venous stenosis as well as the size of the left heart system and its wall motion are illustrated by imaging the venous return phase. Pulmonary regurgitation is affected not only by the pulmonary valve itself but also by the pulmonary vascular bed and the RV. A degree of pulmonary regurgitation, in turn, influences RV end-diastolic volume and work efficiency. RV end-diastolic volume is referred when determining indication of reoperation for pulmonary valve regurgitation after repair of tetralogy of Fallot. RV dilation eventually affects LV function.4, 5)
Nowadays, cardiovascular MRI is popular and takes place frequently. In spite of the trend, we describe how significant the data derived from cardiac catheterization are, compared with those from MRI and other procedures, in the following section.
Right Heart Angiography Versus MRI and Other Procedures in CHD
Right heart angiography for CHD is usually performed in one or two projections, by injecting contrast medium through a catheter that is invasively inserted into the cardiovascular system. MRI is noninvasive, can produce images without use of contrast agents, and visualizes on multiple planes via a single scan. In recent years, MRI has become the gold standard for RV volumetry. The volume data are quantified without use of geometric assumption. In contrast, RV volume derived from right ventriculography is hypothetical calculation based on the area-length method6) (measuring a cross-sectional area and a length) or the Simpson method7) (determining as integration of thin disks). While MRI is capable of quantifing the amount of regurgitation, angiocardiographic evaluation of regurgitation is mainly qualitative such as how dense the contrast dye stains around the regurgitant site (Sellers classification) or how smoothly the contrast dye flows forward away (Table 1). On the other hand, angiographic assessment of regurgitation is visually dynamic, intuitive, and easy to share with the surgeons. These are advantages of the traditional procedure. When performing cardiac catheterization, it is important to optimize the imaging setup such that arrhythmias are less likely induced and proper cardiovascular pictures are provided. Admitting that MRI is the gold standard for RV volumetry, there is room for some factors of human error; visual judgement and handling are involved in multiple occasions when, for example, determining the lumen, setting the region of interest (ROI), and so on. A comprehensive and organized management should be sought in the light of volumetric evaluation derived from each modality employed.
Table 1 Comparison between cardia and MRI catheterization for assessment of right heart | Cardiac catheterization | vs | MRI |
|---|
| Right ventricular volume | Right ventriuclography
Conductance catheter (uncommon) | << | Gold Standard |
| Flow measurement | Right ventriuclography
Pulmonary arteriography
Fick method
Thermodilution
Flow wire (uncommon) | << | Ventricular volume change
Phase Contrast |
| Pulmonary regurgitation volume | Qualitative | << | Quantitative |
Pressure measurement
Blood sumpling
Catheter intervention | Possible | >>> | Impossible |
As a downside, MRI has specific contraindications. CT and cardiac catheterization have an issue of radiation exposure. CT produces static imaging only. On the other hand, cardiac angiography has the finest spatial resolution (cardiac catheterization>CT>MRI). In this respect, cardiac catheterization remains important in some cases, even if performed only for morphological diagnosis or angiographic delineation of small vessels. When examining a patient on MRI or CT, even a “single move” of the patient’s body would make the pictures much less reliable. In angiocardiography, such a factor would not spoil the whole evaluation.
Despite these favorable features, nonetheless, the invasive nature of cardiac catheterization and radiation exposure need to be taken into consideration. As far as focusing on morphological diagnosis, MRI is appropriate in general and superior to echocardiography or CT. The main role of cardiac catheterization is direct pressure evaluation at various sites necessary for basic and precise understanding of cardiovascular status. This feature is to be described in the next section. Another obvious merit of catheter evaluation is that the investigation can be combined with catheter intervention.
Functional Assessment Using Pressure Data
We discuss here the greatest advantage of cardiac catheterization; that is, general understanding of cardiovascular function on the basis of pressures measured.
Through a catheter, we can directly and accurately measure pressures and pressure gradients at various locations. The amount of pulmonary or systemic blood flow is usually calculated using the Fick method with measured values of oxygen saturation. Since PA pressure, the amount of pulmonary blood flow, and pulmonary vascular resistance are accurately measured, cardiac catheterization has a good indication for evaluating pulmonary hypertension and determining efficacy of treatments.3) The right heart circulation is a low-pressured system, and the so-called ‘drift’ phenomenon has a considerable impact on values to be measured. The zero point must be aligned precisely with great care.
Pulmonary hypertension has been defined as a mean PA pressure of ≥25 mmHg. The actual figure of PA pressure alone is, in reality, not sufficient to scrutinize pulmonary hypertension. Pulmonary vascular resistance should be lower with a greater amount of pulmonary blood flow, even if the pressure differences were identical between mean PA pressure and pulmonary capillary wedge pressure. RV systolic pressure can be estimated, in a noninvasive way, from velocity of tricuspid regurgitation, and mean PA pressure from that of pulmonary regurgitation, on echocardiography. As mentioned above, it is also important to pay attention to the amount of pulmonary blood flow. Echocardiography can provide an approximate value of the amount. Use of Esculon Mini®, electrical velocimetry, is another way. This equipment can measure systemic blood flow by affixing electrodes.8) In the absence of an intracardiac shunt, the value is deemed equivalent to the amount of pulmonary blood flow. We repeat that it is important to assess pressure information in conjunction with the amount of blood flow.
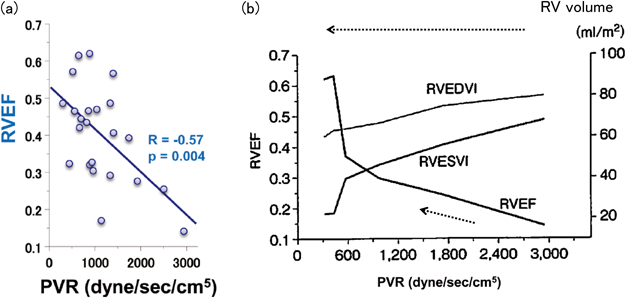
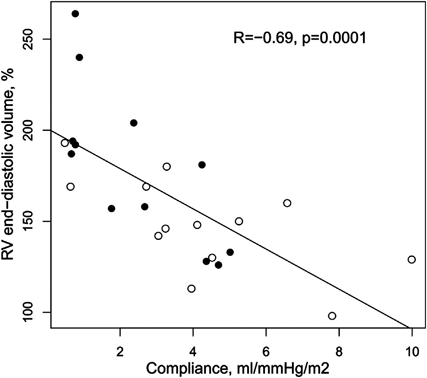
Pulmonary vascular resistance, representing afterload to the RV, is the most important determinant of pulmonary hypertension; RVEF was adversely correlated with pulmonary vascular resistance in a study of pulmonary arterial hypertension in adults9) (Fig. 3(a)). A case report describes that RV volume decreased and RVEF improved in parallel with a fall of pulmonary vascular resistance responding to treatment of pulmonary hypertension10) (Fig. 3(b)); this is of interest in considering the relationship between RV behavior and pulmonary vascular resistance. RVEF improved rapidly when pulmonary vascular resistance came down below 600 dyne/sec/cm5 (7.5 units×m2).
Systolic, diastolic, and mean pressures are recorded in the left, right, and central PAs. The product ‘mean PA pressure minus pulmonary capillary wedge pressure’ is a pressure gradient across the pulmonary circulation, which is divided by the amount of pulmonary blood flow to calculate pulmonary vascular resistance. In the pediatric field, it is often multiplied by the body surface area and expressed in Wood units×m2. The figure of wood units is equivalent to that in dyne/sec/cm5 divided by 80. When a stroke volume is divided by a difference between systolic and diastolic PA pressures (the so-called pulse pressure), we can readily obtain PA compliance. The greater the pulse pressure was with the same stroke volume per beat, the less compliant the pulmonary vascular bed would be; that is, the pulmonary vasculature should be stiffer against expansion.
RV pressure is measured as systolic and end-diastolic. End-diastolic pressure (EDP) is a simple and useful index; this is an integrated marker of the diastolic phase determined by preload to and stiffness of the RV. In addition, RV minimum pressure is also recorded. Minimum pressure provides important information on diastolic capacity, which is the integration of interaction among how far the ventricle can contract during systole, how quickly it relaxes afterward, and how much ventricular suction occurs. Elevated right atrial and central venous pressures suggest diastolic dysfunction of the RV or volume overload to the RV as far as the tricuspid valve remains intact. Furthermore, solely from pressure measurements, an index of contractility (dp/dt max) and indices of relaxation (dp/dt min and the time constant tau for relaxation) are calculated.
In ordinary pressure measurement using a transducer via a pressure line filled with saline, a waveform often fails to follow an instantaneous change of pressure, and tends to overshoot near RV minimum pressure; the pressure swings unusually lower than actually is. Accordingly, measured RV minimum pressure requires interpretation of the pressure curve on the basis of knowledge what an exact pressure curve should be. It is also difficult to calculate accurately dp/dt max and dp/dt min from the derivative of the pressure waveform, or the time constant tau, in ordinary pressure measurement. These assessments can be performed accurately by inserting a thin wire with a pressure transducer mounted11, 12) into a catheter, although uncommon in children.
Following the end of systole, the first diastolic process is relaxation. During relaxation, ventricular volume remains unchanged, and intracavity pressure drops until it goes below atrial pressure, which allows opening of the atrioventricular valve and initiating the process of filling from the atrium to the ventricle. The rate of RV relaxation (time constant tau) should be as important as that of the left heart in order to initiate ventricular filling smoothly. Its clinical significance in the RV, however, has not been fully elucidated, and further studies are needed. Different from the LV, the RV ejects blood into the low-pressured pulmonary circulation in patients without pulmonary hypertension. Furthermore, indices derived from pressures alone are affected by preload and afterload to the RV. Each of the loading conditions poses their own limitation. It is important to evaluate or analyze RV function in a load-independent (or less load-dependent) manner. In this respect, the concept of pressure-volume relationship described in the next section is useful for the RV as is the case with the LV. Although pressure-volume relationship is considered difficult to apply and to evaluate in general clinical practice, it is possible to adopt the concept even from data obtained by general measurements13) as far as the theory is understood properly. This is the topic in the next section, along with our findings.
Ventricular Pressure-Volume Relationship and Pressure-Area Relationship
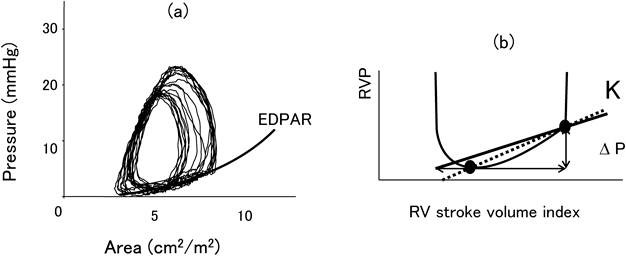
Ventricular pressure-volume relationship is a single counterclockwise loop in a single cardiac cycle, which is determined by plotting the ventricular volume (or cross-sectional area) on the horizontal axis and ventricular pressure on the vertical axis (Fig. 4). In the light of the pressure-volume relationship, cardiac function can be classified into heart rate, preload, afterload, contractility, and diastolic function; eventually these are evaluated together.13) Since this concept is useful for understanding the overall picture of ventricular function, we have provided a brief overview. Animal studies have shown that the pressure-volume relationship in the RV is primarily similar, and has physiological significance, as seen in the LV.14) The time-varying elastance model is also valid for the RV, and the relationship between oxygen consumption and pressure-volume area is similar to that for the LV.14) On the horizontal axis, end-diastolic volume (preload) and end-systolic volume are plotted, and thus, stroke volume and EF are indicated (Fig. 4). Once volume is known, in turn, the position of the pressure-volume curve can be determined on the horizontal axis. The vertical axis is for the ventricular pressure; the height of the loop can be estimated noninvasively from mean blood pressure for the LV or from tricuspid regurgitation velocity (pressure gradient) for the RV.
The end-systolic pressure per stroke volume is called effective arterial elastance (Ea), which is the slope of the right-downward straight line shown in Fig. 4. Ea is an excellent index representing afterload that can be calculated noninvasively. High pressure with poor wall motion is a determinant of increased afterload; we can realize it by assessing Ea. In order to obtain a load-independent index of contractility such as end-systolic elastance (Ees), in contrast, multiple loops are required with different loading conditions, and it is calculated as the slope of the straight line drawn on the left upper shoulder of each loop. Temporary occlusion of the inferior vena cava using an occlusive balloon is a relatively easy way to alter loading conditions, but not really common in practice. Other methods to estimate Ees using a single loop or various noninvasive measurement have been reported for the LV.15, 16) Further investigation is required to clarify whether Ees of the RV can reasonably be estimated from a solitary loop or not.
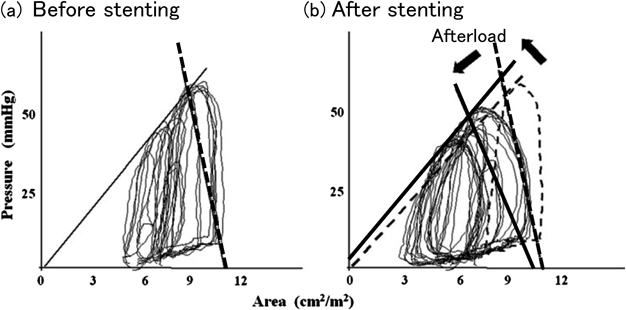
The ratio of contractility (Ees) to afterload (Ea), Ees/Ea, is called as ventriculo-arterial coupling, and indicates whether contractility is commensurate with afterload. This is an important concept related to cardiac mechanical efficiency.17, 18) A similar index is obtained using cross-sectional area, instead of volume, for the x-axis of the ventricular pressure-volume relationship.11) We describe here a suggestive patient19) in whom catheter intervention was effective on RV functional dynamics and this was proved by establishing RV pressure-area relationship during the procedure.
Shown in Fig. 5 is a change in the RV pressure-area relationship in a patient who underwent bilateral stenting of the peripheral PAs to relieve their stenoses after repair of tetralogy of Fallot.19) The interventional procedure reduced RV preload and afterload, and at the same time improved contractility slightly. As expected, the RV became less tense with reduced pressure and afterload, and could eject blood more efficiently with a better contractile circumstance. From this consequence, we realize how the RV would behave and respond. These phenomena are often overlooked when evaluating pressure gradients alone. For example, just imagine where a stenosis was successfully dilated with morphological improvement but the pressure gradient across the lesion remained unchanged. Although sounds pessimistic, this circumstance should be considered effective as far as blood flow had increased sufficiently across the site. The resistance across that site is to be calculated as decreased. Even if an actual pressure-volume curve cannot be plotted, we can envisage the changes in the pressure-volume relationship. It is crucial to recognize the whole picture systematically in the blood flow and volume matter.
The next topic is stiffness of the ventricle, the capacity of late diastolic expansion; that is, the pressure required to increase a certain unit of volume. A standard index for this evaluation is stiffness β, which is obtained by approximating the curve consisting of end-diastolic points with an exponential function at different loads (Fig. 6(a)). The β is a load-independent index of stiffness, which is difficult to calculate (even if approached invasively). For actual filling, a chamber stiffness (K) seems more important20) than the β index. For the chamber stiffness, pressure increase from the phase of minimum ventricular pressure to end-diastole is divided by the change of volume over the corresponding period, We further simplify this equation (Fig. 6(b)) to the formula below for approximation12, 21): LV stiffness is an independent determinant of pulmonary-to-systemic blood flow ratio in atrial septal defects, i.e., the greater the LV stiffness was, the greater the pulmonary-to-systemic blood flow ratio would be.21) The relationship between LV stiffness and other echo indices has been also reported in children.12) Using this method, stiffness can be easily calculated from ordinary cardiac catheterization data. The concept is to be applied to the RV as well. We have noted that calculated K for the RV positively correlates with right atrial contractility Ees (unpublished data). This finding indicates that right atrial contractility rises in response to an increase in RV stiffness that is an afterload to right atrial contraction. It is suggested that interaction exists between the right atrium and the RV. ‘Diastolic stiffness’ may seem difficult to understand at a glance. The simplified method for quantifying this feature of the pumping chamber can be used in routine cardiac catheterization, and is expected to contribute to future investigations in diastolic function in CHD.
Simultaneous Measurement of Pressure and the Amount of Blood Flow
In this section, we briefly discuss two concepts, impedance and wave intensity; these can be calculated by measuring pressure and the amount of blood flow simultaneously. The former provides detailed information about the pulmonary vascular bed, while the latter about RV-PA coupling. We believe that these factors should promote understanding of the pathogenesis of CHD in the future.
Pulsatile pressure and the amount of blood flow is regarded as a periodic function per beat. The function can be approximated by the sum of a steady flow and several sine waves whose fundamental frequency is a single cardiac cycle. The pressure-to-flow ratio of the steady flow components is the vascular resistance. For the sine-wave components, the ratio of amplitude of each frequency behaves as if to be a “resistance” at each frequency. All these together, the resistant characteristics is called impedance.
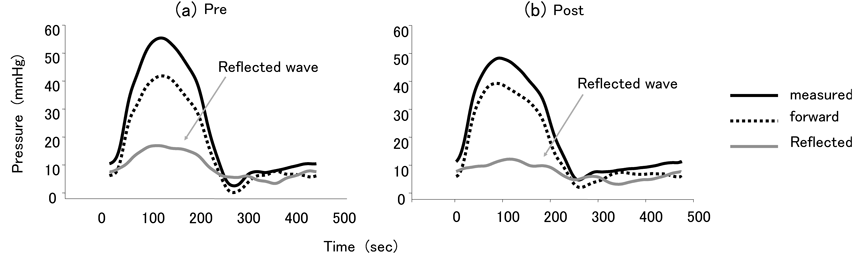
Input impedance of the PA is a RV afterload, and calculated by simultaneously measuring pressure and the amount of blood flow in the PA. This evaluates not only pulmonary vascular resistance, but also compliance of the vessel, compliance that represents distensibility and characteristic impedance22) that documents stiffness of the proximal PA wall as well as detailed properties of the pulmonary vascular bed such as reflection.23) In repaired tetralogy of Fallot, for example, pulmonary vascular resistance is greater, pulmonary blood flow refluxes more, and the PAs are less compliant than normal23); i.e., their vascular beds are more reluctant to flow, more bouncing, and less capable of receiving stroke volume than normal. These would be unfavorable for the pulmonary circulation after all. Pulmonary valve regurgitation is often mentioned as the target lesion of RV enlargement in repaired tetralogy. Less compliant PA, nonetheless, is associated with dilatation of the cavity as shown in Fig. 7. This pulmonary vascular characteristic is an important factor of RV enlargement independent of pulmonary valve regurgitation in multivariate analysis.23) In the analysis of our tetralogy case mentioned earlier, stenting of the stenoses at the bilateral peripheral PAs reduced pulmonary vascular resistance, characteristic impedance (indicating proximal stiffness), impedance of low-frequency components, and reflection (Fig. 8). The pulmonary circulation became smooth and efficient after the interventional procedure; the improvement was detected by impedance analysis.19)
Wave intensity is the product of the derivatives of the pressure and that of the flow waveforms simultaneously recorded, which enables evaluation of ventriculo-arterial coupling.24, 25) Wave intensity has been applied to the PAs.26) Noninvasive calculation of the index has also been attempted using MRI.27) In cardiac catheterization, pressure and the amount of blood flow can be measured simultaneously using a combination wire. In our previous study, we found an association between severe pulmonary valve regurgitation after tetralogy repair and the second part of wave intensity as an independent factor by multivariate analysis.28, 29)
How does the nature of the pulmonary vascular bed influence the pathogenesis of the pulmonary circulation? How about the RV-PA coupling? In repaired tetralogy, residual pulmonary valve stenosis of a mild degree has been generally regarded as favorable against progressive RV enlargement related to pulmonary valve regurgitation.30, 31) But, the circumstance is not as simple as that. Quite a few factors have a significant impact on determining the amount of regurgitant flow across the pulmonary valve; such as morphology of the valve, features of the pulmonary vascular bed (including vascular resistance and compliance), RV function, and RV-PA coupling. Equivalent pressure gradients across stenotic pulmonary valves should behave differently. Reducing the stenosis could be beneficial outweighing disadvantages posed by volume overload in the long-term in some patients, whereas to increase regurgitation would be disadvantageous in others over the long-term benefits by pressure offloading. When contemplating whether intervention is to be carried out or not for peripheral PA stenosis, characteristics of the pulmonary vascular bed, RV function, and RV-PA coupling should play important roles. Changes responding to interventional treatments, once employed, would be regulated by these factors. We ought to go beyond making decisions for interventions based solely on morphological appearance and pressure gradient there. We ought to arrange tailor-made treatments based on a good understanding of the nature of the pulmonary vascular bed, RV function, and RV-PA coupling. This is an important issue for our future practice.
Before the development of echocardiography, cardiac catheterization used to be the most basic method for evaluating cardiac function. As a matter of fact, the threshold for invasive testing has increased as noninvasive methods develop. Still, cardiac catheterization is an important option for accurate assessment of the pulmonary circulation and RV function. Cardiac catheterization provides valuable information. There is room for advancement of this technique, even more profound, in pathophysiological evaluation of the RV and pulmonary vasculature. Pathophysiology is different from one individual to another; a diagnostic entity does not warrant a solitary pattern of physiology. Moreover, each entity is not necessarily comprised of an extensive number of patients. It is difficult to establish a uniform scientific basis for determining their treatment plans. Therefore, the optimal treatment strategy is to be chosen based on understanding characteristics and details in each individual patient. It is necessary to have an insight what the impact of treatments to be planned would be and how the decision should be made. Detailed evaluation of pathophysiology should clarify these aspects and potential prognoses in each patient.
Financial Disclosure
The authors have no financial relationships relevant to this article to disclose.
Conflict of Interest
The authors have no conflicts of interest relevant to this article to disclose.
Originally published in Journal of Adult Congenital Heart Disease, Vol. 4 (2015), pp. 36–45. [in Japanese]
引用文献References
1) Gulati A, Ismail TF, Jabbour A, et al: The prevalence and prognostic significance of right ventricular systolic dysfunction in nonischemic dilated cardiomyopathy. Circulation 2013; 128: 1623–1633
2) van de Veerdonk MC, Kind T, Marcus JT, et al: Progressive right ventricular dysfunction in patients with pulmonary arterial hypertension responding to therapy. J Am Coll Cardiol 2011; 58: 2511–2519
3) Feltes TF, Bacha E, Beekman RH 3rd, et al: American Heart Association Congenital Cardiac Defects Committee of the Council on Cardiovascular Disease in the Young; Council on Clinical Cardiology; Council on Cardiovascular Radiology and Intervention; American Heart Association: Indications for cardiac catheterization and intervention in pediatric cardiac disease: A scientific statement from the American Heart Association. Circulation 2011; 123: 2607–2652
4) Masutani S, Senzaki H: Preserved stroke volume late after tetralogy repair, despite severe right ventricular dilatation. Heart 2013; 99: 1875
5) Kempny A, Diller GP, Orwat S, et al: Right ventricular-left ventricular interaction in adults with tetralogy of Fallot: A combined cardiac magnetic resonance and echocardiographic speckle tracking study. Int J Cardiol 2012; 154: 259–264
6) Arcilla RA, Tsai P, Thilenius O, et al: Angiographic method for volume estimation of right and left ventricles. Chest 1971; 60: 446–454
7) Graham TP Jr., Jarmakani JM, Atwood GF, et al: Right ventricular volume determinations in children: Normal values and observations with volume or pressure overload. Circulation 1973; 47: 144–153
8) Tomaske M, Knirsch W, Kretschmar O, et al: Working Group on Non-invasive Haemodynamic Monitoring in Paediatrics: Cardiac output measurement in children: Comparison of Aesculon cardiac output monitor and thermodilution. Br J Anaesth 2008; 100: 517–520
9) Inaba T, Yao A, Nakao T, et al: Volumetric and functional assessment of ventricles in pulmonary hypertension on 3-dimensional echocardiography. Circ J 2013; 77: 198–206
10) Yao A: Pulmonary hypertension associated with congenital shunting heart disease. [Translated from Japanese] Kokyu To Junkan 2013; 61: 1128–1135 (in Japanese)
11) Senzaki H, Chen CH, Masutani S, et al: Assessment of cardiovascular dynamics by pressure-area relations in pediatric patients with congenital heart disease. J Thorac Cardiovasc Surg 2001; 122: 535–547
12) Masutani S, Saiki H, Kurishima C, et al: Assessment of ventricular relaxation and stiffness using early diastolic mitral annular and inflow velocities in pediatric patients with heart disease. Heart Vessels 2013; 29: 825–833
13) Saiki H, Senzaki H: Basic concepts of circulatory physiology in congenital heart disease: A view from pressure-volume relationship. Pediatr Cardiol Card Surg 2011; 27: 76–87 (in Japanese)
14) Yamada O, Kamiya T, Suga H: Right ventricular mechanical and energetic properties. Jpn Circ J 1989; 53: 1260–1268
15) Chen CH, Fetics B, Nevo E, et al: Noninvasive single-beat determination of left ventricular end-systolic elastance in humans. J Am Coll Cardiol 2001; 38: 2028–2034
16) Senzaki H, Chen CH, Kass DA: Single-beat estimation of end-systolic pressure-volume relation in humans: A new method with the potential for noninvasive application. Circulation 1996; 94: 2497–2506
17) Little WC, Cheng CP: Left ventricular-arterial coupling in conscious dogs. Am J Physiol 1991; 261: H70–H76
18) Suga H: Ventricular energetics. Physiol Rev 1990; 70: 247–277
19) Khono K, Tamai A, Kobayashi T, et al: Effects of stent implantation for peripheral pulmonary artery stenosis on pulmonary vascular hemodynamics and right ventricular function in a patient with repaired tetralogy of Fallot. Heart Vessels 2011; 26: 672–676
20) Oh JK, Hatle L, Tajik AJ, et al: Diastolic heart failure can be diagnosed by comprehensive two-dimensional and Doppler echocardiography. J Am Coll Cardiol 2006; 47: 500–506
21) Kurishima C, Inuzuka R, Kuwata S, et al: Influence of left ventricular stiffness on hemodynamics in patients with untreated atrial septal defects. Circ J 2015; 79: 1823–1827
22) Masutani S, Iwamoto Y, Ishido H, et al: Relationship of maximum rate of pressure rise between aorta and left ventricle in pediatric patients. Circ J 2009; 73: 1698–1704
23) Inuzuka R, Seki M, Sugimoto M, et al: Pulmonary arterial wall stiffness and its impact on right ventricular afterload in patients with repaired tetralogy of Fallot. Ann Thorac Surg 2013; 96: 1435–1441
24) Sugawara M, Niki K, Chang D: Atherosclerosis from the interference between the heart and the arterial system: Application of wave intensity. [Translated from Japanese] Innervision 2005; 20: 106–112 (in Japanese)
25) Ohte N, Narita H, Sugawara M, et al: Clinical usefulness of carotid arterial wave intensity in assessing left ventricular systolic and early diastolic performance. Heart Vessels 2003; 18: 107–111
26) Lau EM, Abelson D, Dwyer N, et al: Assessment of ventriculo-arterial interaction in pulmonary arterial hypertension using wave intensity analysis. Eur Respir J 2014; 43: 1804–1807
27) Quail MA, Knight DS, Steeden JA, et al: Noninvasive pulmonary artery wave intensity analysis in pulmonary hypertension. Am J Physiol Heart Circ Physiol 2015; 308: H1603–H1611
28) Saiki H, Kuwata S, Kurishima C, et al: Problems in catheter intervention for the right ventricular outflow tract in tetralogy of Fallot. [Translated from Japanese] Pediatr Cardiol Card Surg 2013; 29: s327 (in Japanese)
29) Saiki H, Kuwata S, Kurishima C, et al: Wave intensity analysis of the pulmonary artery in postoperative tetralogy of Fallot: Impact of residual pulmonary stenosis on pulmonary regurgitation and ventricular function. Circulation 2013; 128: A13075
30) Latus H, Gummel K, Rupp S, et al: Beneficial effects of residual right ventricular outflow tract obstruction on right ventricular volume and function in patients after repair of tetralogy of Fallot. Pediatr Cardiol 2013; 34: 424–430
31) van der Hulst AE, Hylkema MG, Vliegen HW, et al: Mild residual pulmonary stenosis in tetralogy of fallot reduces risk of pulmonary valve replacement. Ann Thorac Surg 2012; 94: 2077–2082
32) Zile MR, Baicu CF, Gaasch WH: Diastolic heart failure: Abnormalities in active relaxation and passive stiffness of the left ventricle. N Engl J Med 2004; 350: 1953–1959
33) Ohno M, Cheng CP, Little WC: Mechanism of altered patterns of left ventricular filling during the development of congestive heart failure. Circulation 1994; 89: 2241–2250
 ,Hideaki SenzakiSatoshi Masutani