A nationwide and school-based ECG screening program for heart diseases was set for the 1st- (6 years old), the 7th- (12 years old), and the 10th- (15 years old) grade children and adolescents in Japan by legislation in 1994.1) The program aims to detect and diagnose heart diseases at an early stage, to help students with heart disease receive appropriate treatment, to offer instructions to manage daily activities, and to prevent sudden cardiac death.2) Introduction of the program in addition to the initiation of public use of automated external defibrillators in 2004 has significantly decreased the prevalence of sudden cardiac death under school supervision.3) One of the reasons for the decrease was a reduction in cardiac events by arrhythmia syndromes, particularly long QT syndrome (LQTS). A previous study carried out from 2005 to 2009 showed that in 9 of 58 children (16%) with out-of-hospital cardiac arrest was due to LQTS.4) In comparison, another study from 2012 to 2016 showed that no children or adolescents with LQTS were included among 61 subjects with pre-existing cardiovascular diseases who experienced out-of-hospital cardiac arrest.5) A speculated reason for this result is that the program disclosed children and adolescents with a broad spectrum of QT intervals from a low possibility to a definite probability of LQTS. Consequently, the program helped us diagnose the disease at an early stage, allowed us to implement early intervention with daily activities or treatment, and finally prevented them from cardiac events which was indeed the aim of the program.
The major causes of out-of-hospital cardiac arrest in children and adolescents in Japan are congenital heart diseases, arrhythmia syndromes, myocardial diseases including hypertrophic cardiomyopathy (HCM), and coronary artery diseases.4, 5) Among these, a previous study showed that approximately 60% (27/44) of school-age children and adolescents who suffered sudden cardiac death or aborted cardiac arrest had not been diagnosed with HCM before their cardiac events.6) A recent study revealed that a mean thickness of interventricular septum (IVST) in 9 patients at initial diagnosis was already 19.8±4.5 cm (excluding 2 patients pathologically diagnosed), although they were diagnosed through a school-based electrocardiographic (ECG) screening program (Supplementary Table 1).7) Their IVST fulfilled the diagnostic criteria of adult HCM (maximal end-diastolic left ventricular wall thickness (LVWT)≥15 mm anywhere in the left ventricle in the absence of another cause of hypertrophy)8, 9) even though they were still approximately 12 years old.7) These data suggest that the current screening system might not be effective for early assessment of increased LVWT.
ECG findings are known to precede echocardiographic findings in patients with HCM.7, 10–13) A recent study showed that early prediction for the potential diagnosis of HCM was possible using new ECG voltage criteria of (R wave in lead V3)+(S wave in lead V3) during the 1st grade in more than 50% of patients who did not fulfill conventional criteria during the first grade but were eventually diagnosed as HCM during the 7th grade (Supplementary Table 1).7) Another study reported that 13 of 54 pediatric patients (30%) had ECG abnormalities but no echocardiographic findings of myocardial hypertrophy at the time of the screening program. The authors suspected that these 13 patients would develop cardiomyopathy and followed-up them.13) These patients developed myocardial hypertrophy during follow-up and were finally diagnosed as having HCM.13) Currently, however, there are no published echocardiographic cut-off criteria to follow for increased myocardial hypertrophy. Therefore, echocardiographic assessment of increased LVWT is needed for children and adolescents who were screened by ECG. Early prediction of myocardial hypertrophy via ECG7, 13) and echocardiography may help us recognize the presence of increased LVWT.
The aim of the present study was to determine the tentative echocardiographic cut-offs for increased LVWT for the 1st, the 7th, and the 10th grade children and adolescents using the standard deviation (SD) score of LVWT based on data from the general population.
Participants
The participants were 623 school-age healthy volunteers who participated in a project performed between 2015 and 2017 at 11 cardiovascular centers or hospitals where pediatric cardiologists qualified by the Japanese Society of Pediatric Cardiology and Cardiac Surgery belonged to. Participants were recruited via the websites of the authors’ affiliated hospitals. The participants comprised children and adolescents of three grades as follows: the 1st grade (or 6 years old), the 7th grade (or 12 years old), and the 10th grade (or 15 years old) because school-based screening programs in Japan had been set for these three grades. The exclusion criteria were for those who had underlying disease, who took regular medications, who had family history of non-ischemic cardiomyopathy or cardiac hypertrophy, who were obese, and who had abnormal ECG findings at the time of echocardiographic imaging. Obesity was defined by the international cut-off point of a body mass index of 30 kg/m2 at age 18 years, established by Cole et al.14) Written informed consent was obtained from the participants’ parents or guardians. The study complied with the guidelines of the Declaration of Helsinki and was approved by the Ethics Committee of the NHO Kagoshima Medical Center (No. 28–36).
Echocardiographic Studies
Echocardiography was performed using commercially available equipment at each institution in accordance with a standard protocol designed for the present study. The protocol was created by one of the coauthors (S.S.) who participated in a multicenter and prospective study by Kobayashi et al.15) according to the recommendations of the American Society of Echocardiography and the European Association of Cardiovascular Imaging.16) The values for LVWT were carefully obtained perpendicular to the left ventricular long axis by measuring at papillary muscle levels immediately below the level of mitral valve16) in end diastole. Measurements on both long and short axis views were accepted in the present study. Participating researchers were asked to save the echocardiographic data at their institutions. Data for IVST and left ventricular posterior wall thickness (PWT) were used in the analyses this time. Each measurement was performed five times, and the average of the middle three data excluding the maximum and minimum values was calculated. After obtaining the final data of all participants, participating researchers were asked to check the data over or under the mean ±2 SD using the saved echocardiographic images.
Creating Cut-Offs for Increased LVWT
The prevalence of increased LVWT in the pediatric general population is unclear. To address this, we attempted to avoid at least a false negative diagnosis of HCM, one of the most important diseases associated with myocardial hypertrophy, and referred to the prevalence of pediatric patients with HCM in Japan.7) The mean annual occurrence of new cases of childhood HCM (aged <20 years) between 2015 and 2019 in Japan was 0.36 per 100,000 (95% confidence interval [CI]: 0.25–0.45 per 100,000),7) which corresponds to the range in previous reports of 0.24–0.47 per 100,000.17–20) Arola et al. reported a mean annual occurrence of HCM between 1980 and 1991 as 0.24 per 100,000 (95% CI: 0.17–0.33 per 100,000) and a prevalence of HCM at the end of 1991 as 2.9 per 100,000 (95% CI: 2.0–4.0 per 100,000); i.e., 1/34,000.17) Thus, the prevalence of childhood HCM in Japan would have been 4.35 (2.9×0.36/0.24) per 100,000; i.e., 1/23,000. Therefore, the tentative cut-offs for increased LVWT to predict future presence of HCM may be around 1/23,000, namely between 1/10,000 and 1/30,000.
There may be a concern about the possibility of false negative cases; nevertheless, values of the measured variables from the general population usually show a wide-tailed distribution. For example, the statistical point of 1/4000 for corrected QT intervals to screen subjects with prolonged QT interval from a general population actually screened 1/592, 1/1143, 1/520, and 1/446 participants in 7th grade males, 7th grade females, 10th grade males, and 10th grade females, respectively.21) These data suggested statistical points at 1/10,000 to 1/30,000 seemed appropriate to minimize false positives and false negatives.
Physical Parameters of the Participants
Height, weight, and blood pressure were measured. Body mass index was calculated as weight (in kilograms) divided by the square of the height (in meters). Blood pressure was measured three times in the sitting position after 10 minutes of rest and a mean value of the second and the third measurements was used. Body surface area (BSA) was calculated using the formulae of Haycock et al.,22) DuBois & DuBois,23) and Fujimoto et al.24)
Statistical Analysis
To adjust the measured LVWT for BSA, the following exponential model25) was used: where α is the parameter of the exponent. The α value was calculated by simple regression analysis using log-transformed measured IVST as a dependent variable and log-transformed BSA as an independent variable.
Statistical significance for the difference in mean values between the sexes was determined using Student’s t test. Statistical significance for the difference in mean values of the variables among the grades was determined using analysis of variance and Tukey’s test. Normality was evaluated using the Shapiro–Wilk and Kolmogorov–Smirnov tests. Statistical analysis was performed using IBM SPSS® Statistics Version 23.0 (IBM Japan, Ltd., Tokyo, Japan). A two-tailed probability value of <0.05 was considered statistically significant.
Final Subjects
Of all data for the 623 subjects who participated in this study, those in 35 participants were excluded because of missing (unsaved) data. Data for another 9 participants with obesity were also excluded. The characteristics of the 579 final participants were shown in Table 1. Mean values for IVST and PWT were different between the male and the female groups. IVST and PWT values differed between the 1st and the 7th grades and between the 7th and the 10th grades in males (Supplementary Table 2). In contrast, these data did not differ between the 7th and the 10th grades in females; therefore, the data of the 7th and the 10th grades in females were combined thereafter.
Table 1 Characteristics of the participants | Male | Female | p value | Total |
|---|
| Number of subjects | 293 | 286 | | 579 |
| Age (year) | 10.8±3.8 | 11.0±3.8 | 0.46 | 10.9±3.8 |
| Height (cm) | 142±23 | 139±19 | 0.11 | 140±21 |
| Weight (kg) | 37.4±16.1 | 36.0±13.6 | 0.25 | 36.7±14.9 |
| Body mass index | 17.6±2.6 | 17.8±2.7 | 0.42 | 17.7±2.7 |
| Body surface area | 1.20±0.35 | 1.17±0.31 | 0.25 | 1.18±0.33 |
| Systolic blood pressure (mmHg) | 102±12 | 100±10 | 0.002 | 101±11 |
| Interventricular septal thickness (mm) | 6.6±1.1 | 6.5±1.1 | 0.001 | 6.5±1.1 |
| Posterior wall thickness (mm) | 6.6±1.2 | 6.3±1.2 | 0.003 | 6.4±1.2 |
Association between LVWT and Physical Parameters
LVWT (IVST or PWT) was mostly associated with BSA among the 4 physical parameters (height, weight, blood pressure, and BSA) (Supplementary Table 3). Association coefficients between LVWT and either of the three BSA formulae were similar.
Exponent α in the Exponential Models
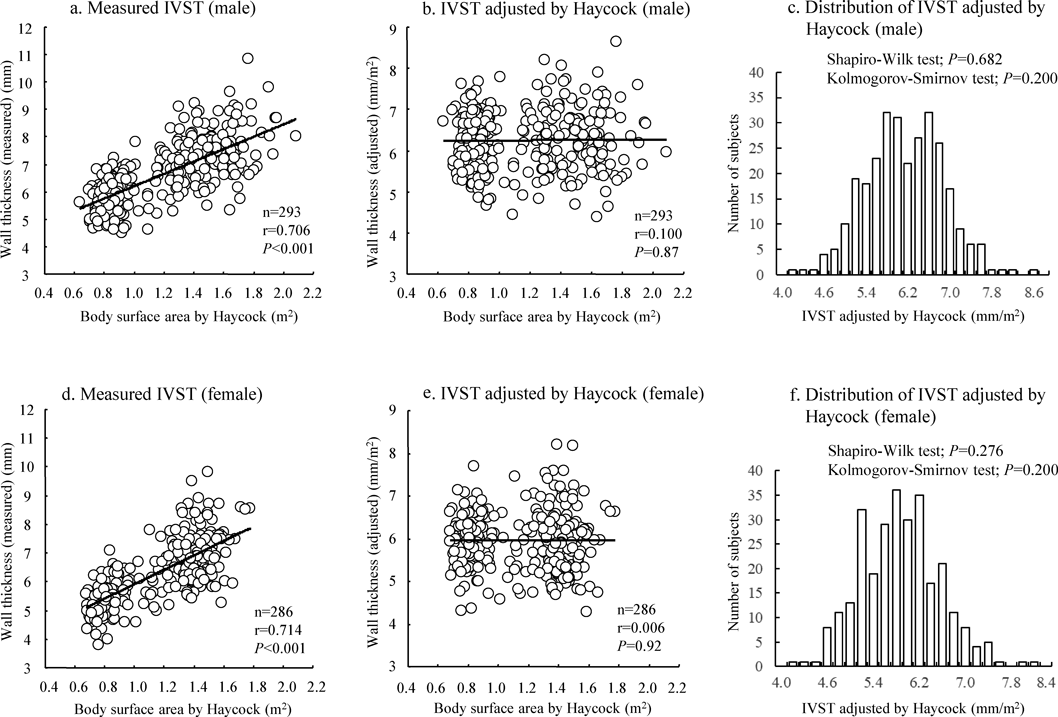
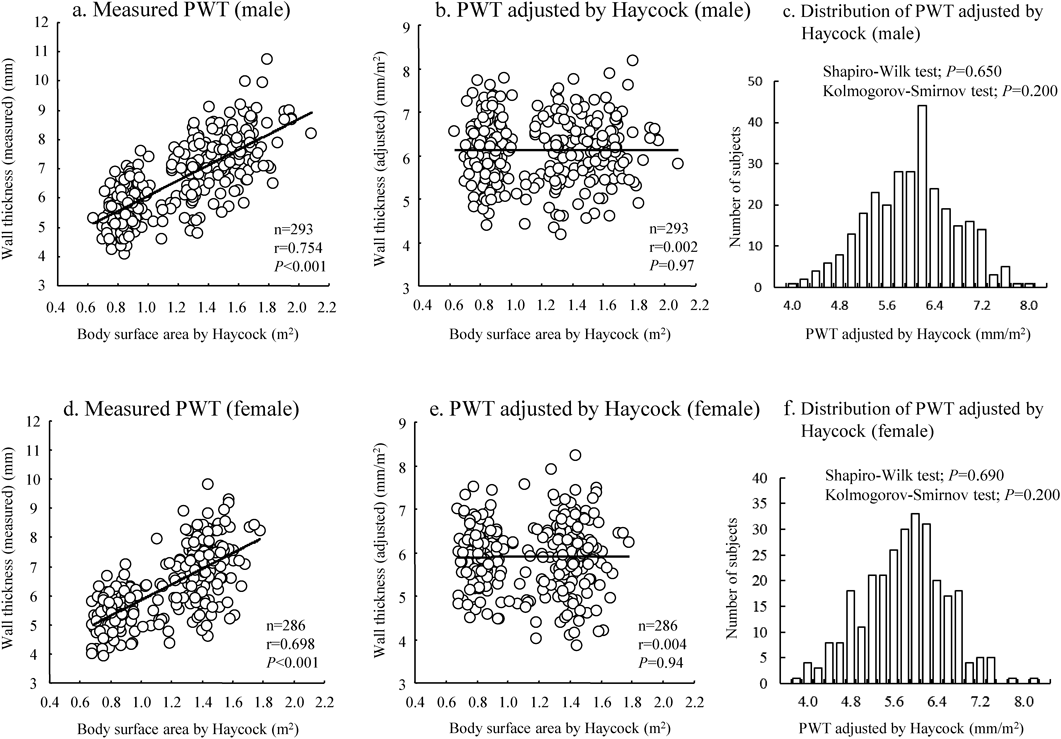
The exponents α in the exponential models to adjust LVWT for BSA were 0.398, 0.394, and 0.396 by Haycock’s, DuBois’, and Fujimoto’s formulae, respectively, in boys, and 0.445, 0.448, and 0.449, respectively, in girls for IVST. For PWT, 0.470, 0.462, and 0.464, respectively, in boys and 0.479, 0.474, and 0.475, respectively, in girls.
Adjustment of LVWT
The relationship between LVWT and BSA before and after adjustment by BSAα as well as distributions of the adjusted values for IVST and PWT were shown in Fig. 1 (IVST) and Fig. 2 (PWT). In these figures, BSA by Haycock’s formula was used. The figures showed that LVWT adjusted by division of BSAα had no significant correlation with BSA (Figs. 1 and 2, the middle panels) and that the adjusted values for LVWT were normally distributed (Figs. 1 and 2, the right panels). The relationships and distribution by BSA of DuBois’ and Fujimoto’s formulae were shown in Supplementary Figs. 1 to 4. Although there were minor differences in the scatter plots and distributions among the three BSA methods, the results were similar.
Tentative Cut-Offs for Increased Adjusted LVWT
Table 2 shows the values for adjusted LVWT at the statistical point from 1/1,000 to 1/30,000 by three different BSA formulae and by sex. Cut-off SD values for adjusted IVST and PWT were almost identical between Haycock’s and DuBois’ formulae in all grades. The cut-off SD levels using the Fujimoto’s formula were one rank lower compared with the other two because the mean IVST and PWT values were slightly larger with the Fujimoto’s formula compared with the other two. The findings suggest that the data by either of the methods were acceptable for clinical use.
Table 2 Tentative screening cut-offs for increased left ventricular wall thickness (adjusted values) by three BSA formulae| [Males] | Formula of BSA correction | n | mean | SD | 1/1000
+3.090SD | 1/2000
+3.291SD | 1/3000
+3.403SD | 1/5000
+3.540SD | 1/10000
+3.719SD | 1/20000
+3.891SD | 1/30000
+3.988SD |
|---|
| IVSTa | 1st graders | Haycock | 135 | 6.23 | 0.69 | 8.4 | 8.5 | 8.6 | 8.7 | 8.8 | 8.9 | 9.0 |
| DuBois | 135 | 6.22 | 0.69 | 8.4 | 8.5 | 8.6 | 8.7 | 8.8 | 8.9 | 9.0 |
| Fujimoto | 135 | 6.29 | 0.70 | 8.5 | 8.6 | 8.7 | 8.8 | 8.9 | 9.0 | 9.1 |
| 7th graders | Haycock | 94 | 6.23 | 0.75 | 8.5 | 8.7 | 8.8 | 8.9 | 9.0 | 9.1 | 9.2 |
| DuBois | 94 | 6.20 | 0.75 | 8.5 | 8.7 | 8.8 | 8.9 | 9.0 | 9.1 | 9.2 |
| Fujimoto | 94 | 6.27 | 0.76 | 8.6 | 8.8 | 8.9 | 9.0 | 9.1 | 9.2 | 9.3 |
| 10th graders | Haycock | 64 | 6.31 | 0.80 | 8.8 | 8.9 | 9.0 | 9.1 | 9.3 | 9.4 | 9.5 |
| DuBois | 64 | 6.30 | 0.80 | 8.8 | 8.9 | 9.0 | 9.1 | 9.3 | 9.4 | 9.5 |
| Fujimoto | 64 | 6.36 | 0.81 | 8.9 | 9.0 | 9.1 | 9.2 | 9.4 | 9.5 | 9.6 |
| Total | Haycock | 293 | 6.25 | 0.73 | 8.5 | 8.7 | 8.7 | 8.8 | 9.0 | 9.1 | 9.2 |
| DuBois | 293 | 6.23 | 0.73 | 8.5 | 8.6 | 8.7 | 8.8 | 8.9 | 9.1 | 9.1 |
| Fujimoto | 293 | 6.30 | 0.74 | 8.6 | 8.7 | 8.8 | 8.9 | 9.1 | 9.2 | 9.3 |
| PWTa | 1st graders | Haycock | 135 | 6.14 | 0.74 | 8.4 | 8.6 | 8.7 | 8.8 | 8.9 | 9.0 | 9.1 |
| DuBois | 135 | 6.12 | 0.74 | 8.4 | 8.6 | 8.6 | 8.7 | 8.9 | 9.0 | 9.1 |
| Fujimoto | 135 | 6.20 | 0.75 | 8.5 | 8.7 | 8.8 | 8.9 | 9.0 | 9.1 | 9.2 |
| 7th graders | Haycock | 94 | 6.02 | 0.77 | 8.4 | 8.6 | 8.6 | 8.7 | 8.9 | 9.0 | 9.1 |
| DuBois | 94 | 6.00 | 0.77 | 8.4 | 8.5 | 8.6 | 8.7 | 8.9 | 9.0 | 9.1 |
| Fujimoto | 94 | 6.08 | 0.78 | 8.5 | 8.6 | 8.7 | 8.8 | 9.0 | 9.1 | 9.2 |
| 10th graders | Haycock | 64 | 6.22 | 0.73 | 8.5 | 8.6 | 8.7 | 8.8 | 8.9 | 9.1 | 9.1 |
| DuBois | 64 | 6.21 | 0.73 | 8.5 | 8.6 | 8.7 | 8.8 | 8.9 | 9.1 | 9.1 |
| Fujimoto | 64 | 6.29 | 0.74 | 8.6 | 8.7 | 8.8 | 8.9 | 9.0 | 9.2 | 9.2 |
| Total | Haycock | 293 | 6.12 | 0.75 | 8.4 | 8.6 | 8.7 | 8.8 | 8.9 | 9.0 | 9.1 |
| DuBois | 293 | 6.11 | 0.75 | 8.4 | 8.6 | 8.7 | 8.8 | 8.9 | 9.0 | 9.1 |
| Fujimoto | 293 | 6.18 | 0.76 | 8.5 | 8.7 | 8.8 | 8.9 | 9.0 | 9.1 | 9.2 |
| [Females] | Formula of BSA correction | n | mean | SD | 1/1000
+3.090SD | 1/2000
+3.291SD | 1/3000
+3.403SD | 1/5000
+3.540SD | 1/10000
+3.719SD | 1/20000
+3.891SD | 1/30000
+3.988SD |
|---|
| IVSTa | 1st graders | Haycock | 120 | 5.95 | 0.62 | 7.9 | 8.0 | 8.1 | 8.1 | 8.3 | 8.4 | 8.4 |
| DuBois | 120 | 5.95 | 0.62 | 7.9 | 8.0 | 8.1 | 8.1 | 8.3 | 8.4 | 8.4 |
| Fujimoto | 120 | 6.01 | 0.63 | 8.0 | 8.1 | 8.2 | 8.2 | 8.4 | 8.5 | 8.5 |
| 7th/10th graders | Haycock | 166 | 5.97 | 0.74 | 8.3 | 8.4 | 8.5 | 8.6 | 8.7 | 8.8 | 8.9 |
| DuBois | 166 | 5.94 | 0.73 | 8.2 | 8.3 | 8.4 | 8.5 | 8.7 | 8.8 | 8.9 |
| Fujimoto | 166 | 6.01 | 0.74 | 8.3 | 8.4 | 8.5 | 8.6 | 8.8 | 8.9 | 9.0 |
| Total | Haycock | 286 | 5.96 | 0.69 | 8.1 | 8.2 | 8.3 | 8.4 | 8.5 | 8.6 | 8.7 |
| DuBois | 286 | 5.94 | 0.68 | 8.0 | 8.2 | 8.3 | 8.3 | 8.5 | 8.6 | 8.7 |
| Fujimoto | 286 | 6.01 | 0.69 | 8.1 | 8.3 | 8.4 | 8.5 | 8.6 | 8.7 | 8.8 |
| PWTa | 1st graders | Haycock | 120 | 5.90 | 0.68 | 8.0 | 8.1 | 8.2 | 8.3 | 8.4 | 8.5 | 8.6 |
| DuBois | 120 | 5.88 | 0.68 | 8.0 | 8.1 | 8.2 | 8.3 | 8.4 | 8.5 | 8.6 |
| Fujimoto | 120 | 5.95 | 0.69 | 8.1 | 8.2 | 8.3 | 8.4 | 8.5 | 8.6 | 8.7 |
| 7th/10th graders | Haycock | 166 | 5.89 | 0.83 | 8.5 | 8.6 | 8.7 | 8.8 | 9.0 | 9.1 | 9.2 |
| DuBois | 166 | 5.89 | 0.83 | 8.5 | 8.6 | 8.7 | 8.8 | 9.0 | 9.1 | 9.2 |
| Fujimoto | 166 | 5.96 | 0.84 | 8.6 | 8.7 | 8.8 | 8.9 | 9.1 | 9.2 | 9.3 |
| Total | Haycock | 286 | 5.90 | 0.77 | 8.3 | 8.4 | 8.5 | 8.6 | 8.8 | 8.9 | 9.0 |
| DuBois | 286 | 5.88 | 0.77 | 8.3 | 8.4 | 8.5 | 8.6 | 8.7 | 8.9 | 9.0 |
| Fujimoto | 286 | 5.96 | 0.78 | 8.4 | 8.5 | 8.6 | 8.7 | 8.9 | 9.0 | 9.1 |
| Numerals in red font mean the points of the cut-offs values or those of the nearest cut-off values. BSA, body surface area; IVSTa, adjusted interventricular septal thickness; PWTa, adjusted posterior wall thickness; SD, standard deviation. |
The tentative cut-offs for adjusted LVWT were 9.0 mm for both IVST and PWT in males. More precisely, however, the tentative cut-off for IVST for the 10th grade males was located at a slightly lower SD level because the SD value for IVST for the 10th grade males was larger than those for the 1st and the 7th grades males. Different values by grade may be appropriate for females, with values of 8.4 mm for the 1st graders and 8.8 mm for the 7th and the 10th graders. No participants exceeded the tentative cut-offs for increased adjusted LVMT, and none were followed up.
Tentative Cut-Offs for Increased Measured (Unadjusted) LVWT
Tentative cut-offs for increased measured LVWT were 8.5, 10.5, and 11.5 mm for the 1st, the 7th, and the 10th graders, respectively, in males (Table 3). The tentative cut-offs were 8.0 mm for the 1st graders and 10.5 mm for the 7th and the 10th graders in females. The tentative cut-offs for PWT for the 7th/10th grades females were also located at a slightly lower SD level because the SD value for PWT for the 7th/10th grades females was larger than that for the 1st grade females. No participants exceeded the tentative cut-offs for increased measured (unadjusted) LVMT, and none were followed up.
Table 3 Tentative screening cut-offs for increased left ventricular wall thickness (measured values) | n | Mean | SD | 1 : 1000
+3.090SD | 1 : 2000
+3.291SD | 1 : 3000
+3.403SD | 1 : 5000
+3.540SD | 1 : 10000
+3.719SD | 1 : 20000
+3.891SD | 1 : 30000
+3.988SD | +6SD† |
|---|
| Male | IVST | 1st graders | 135 | 5.85 | 0.67 | 7.9 | 8.1 | 8.1 | 8.2 | 8.3 | 8.5 | 8.5 | 9.9 |
| 7th graders | 94 | 7.07 | 0.90 | 9.9 | 10.0 | 10.2 | 10.3 | 10.4 | 10.6 | 10.7 | 12.5 |
| 10th graders | 64 | 7.70 | 1.00 | 10.8 | 11.0 | 11.1 | 11.2 | 11.4 | 11.6 | 11.7 | 13.7 |
| PWT | 1st graders | 135 | 5.70 | 0.72 | 7.9 | 8.1 | 8.2 | 8.2 | 8.4 | 8.5 | 8.6 | 10.0 |
| 7th graders | 94 | 7.00 | 0.97 | 10.0 | 10.2 | 10.3 | 10.4 | 10.6 | 10.8 | 10.9 | 12.8 |
| 10th graders | 64 | 7.87 | 0.98 | 10.9 | 11.1 | 11.2 | 11.3 | 11.5 | 11.7 | 11.8 | 13.8 |
| Female | IVST | 1st graders | 120 | 5.48 | 0.62 | 7.4 | 7.5 | 7.6 | 7.7 | 7.8 | 7.9 | 7.9 | 9.2 |
| 7th & 10th graders | 166 | 6.94 | 0.90 | 9.7 | 9.9 | 10.0 | 10.1 | 10.3 | 10.4 | 10.5 | 12.3 |
| PWT | 1st graders | 120 | 5.39 | 0.65 | 7.4 | 7.5 | 7.6 | 7.7 | 7.8 | 7.9 | 8.0 | 9.3 |
| 7th & 10th graders | 166 | 6.94 | 1.04 | 10.2 | 10.4 | 10.5 | 10.6 | 10.8 | 11.0 | 11.1 | 13.2 |
| †The Japanese Normal Values for Echocardiographic Measurement Project (JAMP) study34) and the 2020 AHA/ACC guideline9) showed that 15 mm, which was the diagnostic criteria for HCM in adults, represents a z-score of approximately 6SD above the mean in adults (please refer to the text). Numerals in red font mean the points of the cut-off values or those of the nearest cut-off values. AHA/ACC, American Heart Association/American College of Cardiology; HCM, hypertrophic cardiomyopathy; IVST, interventricular septal thickness; PWT, posterior wall thickness; 1st, first; 7th, seventh; 10th, tenth; SD, standard deviation. |
The present study showed that the adjusted values of IVST and PWT by BSAα were normally distributed in both sexes. Tentative cut-offs for increased adjusted LVWT were 9.0 mm for both IVST and PWT for all the three grades in males and 8.4 mm for the 1st grade and 8.8 mm for the 7th and the 10th grades in females. Simplified cut-offs for increased non-adjusted (measured) LVWT for clinical use were also created.
The diagnostic value of increased ventricular thickness for children is controversial because of the need to adjust for body size and growth.9) Many reports have used echocardiographic variables adjusted by BSA (Supplementary Table 4). Mean values of adjusted LVWT in these reports were generally 6 mm26–28) or 7 mm,29–31) although the exact reasons for the difference were not determined. The difference might not be due to ethnic population of Asian and European/American countries because the present data were comparable to those of Kampmann et al. who evaluated a German population,26) and those of Pettersen et al. (American population)27) and Wang et al. (Chinese population).28) A few reports presented the measured values of LVWT (Supplementary Table 5).32, 33) Jinguji et al. reported the echocardiographic variables before adjustment by BSA for the 1st, the 7th, and the 10th graders,32) age at evaluation being the same in this study. Their data were similar. Subjects in another study by Landon et al. were aged 5–7 and 12–15 years.33) Ages of the subjects were not comparable to those in our study. Still, the data for the measured LVWT were similar to findings by Jinguji et al.32) and the present study. Our data showed that the adjusted and measured LVWT in the present study harmonized with those in previous studies.
Considering the estimated prevalence of HCM in Japan (1/23,000) and the wide-tailed distribution of the variables in the general population, the values listed in Tables 2 and 3 could be candidates as tentative cut-offs for the increased LVWT for school-age children and adolescents. These values correspond to the z-scores of 3 to 4 SD above the means of the present participants. The Japanese Normal Values for Echocardiographic Measurement Project study showed that 15 mm, which was the diagnostic criterion for HCM in adults, was consistent with a z-score of 6 SD and 7 SD above the mean in male and female adults, respectively.34) The 2020 American Heart Association/American College of Cardiology guideline also stated that 15 mm represents a z-score of approximately 6 SD above the mean in adults.9) These data suggest that the cut-offs shown in Tables 2 and 3 would be acceptable for the assessment of increased LVWT in children and adolescents, but not for use as diagnostic values. Therefore, the diagnostic values should be established by further studies for infants, children, and adolescents.
There were limitations in this study. Firstly, the number of subjects was relatively small to determine cut-offs. A small sample size is usually related to a large SD. However, the SD values in this study were smaller than those in other studies (Supplementary Tables 4 and 5), suggesting that the cut-off values for increased LVWT identified in this study could be acceptable for clinical use. Secondly, the mean values for the adjusted LVWT at some institutions differed from others (Supplementary Fig. 5). We included all the data of the participants who fulfilled the inclusion criteria, because the data over or under the mean ±2 SD were re-evaluated by the participating pediatric cardiologists (qualified by the Japanese Society of Pediatric Cardiology and Cardiac Surgery) and the adjusted values for the LVWT for each sex and grade appeared normally distributed. Thirdly, we need to perform some studies to re-confirm the exact sensitivity and specificity of the present tentative cut-offs. Concerning the sensitivity, it might rise up to nearly 100% because we use the z-score of 3 to 4 SD above a mean of the present participants and the current criteria for adult HCM use that of 6 or 7 SD of general population, although some false negative cases may exist. Regarding the specificity, it might be from 99.99% to 99.9997%, because the tentative cut-offs were set at the points of 1/10,000 to 1/30,000. Finally, we did not discuss approaches to minimize a concern of patients and families whether HCM would potentially develop in the future. Further studies are required to provide sufficient information for resolving such a concern and responding to requirements for follow-up.
In conclusion, the present study identified tentative echocardiographic cut-offs for assessment of increased LVWT for school-age children and adolescents. When the patient has a measured value near or over the cut-off, the value should be adjusted by BSAα, and whether the adjusted value is over the cut-off should be determined. Tentative ECG voltage criteria7) and the present tentative echocardiographic cut-offs may help us recognize the presence of increased LVWT, although prospective studies are required. In the meantime, patients should be followed-up with an appropriate interval on the basis of their ECG and echocardiographic findings, and the guidelines on diagnosis and treatment of HCM should be followed.8, 9, 35)
謝辞Acknowledgments
We are grateful to the 623 school-age healthy volunteers and their parents or guardians who agreed to participate in this study. We express our gratitude to the Ministry of Health, Labour and Welfare of Japan for their funding of this study.
Funding
This work was supported by Health and Labour Sciences Research Grants from the Japanese Ministry of Health, Labour, and Welfare (Comprehensive Research on Cardiovascular Diseases; H27-019, H29-034, and 20FC1051) and grants from the Suzuken Memorial Foundation.
Conflicts of Interest
The authors declare no competing interest.
Ethics Approval and Consent to Participate
The study complied with the guidelines of the Declaration of Helsinki and was approved by the Ethics Committee of the NHO Kagoshima Medical Center (No. 28–36).
Patient Consent for Publication
Written informed consent was obtained from the participants’ parents or guardians.
Data Availability
The data that support the findings of this study are available from the corresponding author on reasonable request. However, the approval of the present study by the local Ethical Committee did not include individual data sharing to a third party.
Author Contribution
Conceptualization, M.Y.; Funding acquisition, M.Y., H.T.; Investigation; M.Y. E.N., T.H., K.A., K.O., S.T., Y.N., H.H., K.H., M.I., D.H.; Data curation, M.Y. E.N., T.H., K.A., K.O., S.T., Y. Nomura, H.H., K.H., M.I., D.H., Y. Ninomiya, Y.T., K.K., K.S., H.I., F.T.; Formal analysis, M.Y., H.O., H.T.; Methodology, M.Y., S.S., N.I., N.T., M.N.; Supervision, S.M., H.T., M.N.; Writing—original draft, M.Y.; Writing—review & editing, all authors.
Note
Supplementary is provided online for this article.
引用文献References
1) Yoshinaga M, Iwamoto M, Horigome H, et al: Standard values and characteristics of electrocardiographic findings in children and adolescents. Circ J 2018; 82: 831–839
2) Sumitomo N, Baba R, Doi S, et al: Japanese Circulation Society and the Japanese Society of Pediatric Cardiology and Cardiac Surgery of Joint Working: Guidelines for Heart Disease Screening in Schools (JCS 2016/JSPCCS 2016) —Digest Version—. Circ J 2018; 82: 2385–2444
3) Hazeki D, Yoshinaga M: School-based cardiovascular screening and sudden cardiac death: Emphasis on arrhythmia associated with hypertrophic cardiomyopathy. Nihon Shoni Junkanki Gakkai Zasshi 2021; 37: 255–264 (in Japanese, English abstract)
4) Mitani Y, Ohta K, Ichida F, et al: Circumstances and outcomes of out-of-hospital cardiac arrest in elementary and middle school students in the era of public-access defibrillation: Implications for emergency preparedness in schools. Circ J 2014; 78: 701–707
5) Yoshinaga M, Ishikawa S, Otsubo Y, et al: Sudden out-of-hospital cardiac arrest in pediatric patients in Kyushu area in Japan. Pediatr Int 2021; 63: 1441–1450
6) Abe Y, Ayusawa M, Kato M, et al: Sudden death in schoolchildren: A retrospective study on hypertrophic cardiomyopathy and cardiac events occurring under school supervision. J Pediatr Cardiol Card Surg 2018; 2: 60–67
7) Yoshinaga M, Horigome H, Ayusawa M, et al: Electrocardiographic diagnosis of hypertrophic cardiomyopathy in the pre- and post-diagnostic phases in children and adolescents. Circ J 2021; 86: 118–127
8) Elliott PM, Anastasakis A, Borger MA, et al: Authors/Task Force members: 2014 ESC Guidelines on diagnosis and management of hypertrophic cardiomyopathy. Eur Heart J 2014; 35: 2733–2779
9) Ommen SR, Mital S, Burke MA, et al: 2020 AHA/ACC Guideline for the diagnosis and treatment of patients with hypertrophic cardiomyopathy: A report of the American College of Cardiology/American Heart Association Joint Committee on Clinical Practice Guidelines. Circulation 2020; 142: e558–e631
10) Seki S, Yamashita E, Tanoue K, et al: Prediagnostic electrocardiographic and echocardiographic findings of biopsy-proven hypertrophic cardiomyopathy. J Arrhythm 2018; 34: 643–646
11) Panza JA, Maron BJ: Relation of electrocardiographic abnormalities to evolving left ventricular hypertrophy in hypertrophic cardiomyopathy during childhood. Am J Cardiol 1989; 63: 1258–1265
12) Lakdawala NK, Thune JJ, Maron BJ, et al: Electrocardiographic features of sarcomere mutation carriers with and without clinically overt hypertrophic cardiomyopathy. Am J Cardiol 2011; 108: 1606–1613
13) Morimoto Y, Miyazaki A, Tsuda E, et al: Electrocardiographic changes and long-term prognosis of children diagnosed with hypertrophic cardiomyopathy by the school screening program for heart disease in Japan. J Cardiol 2020; 75: 571–577
14) Cole TJ, Bellizzi MC, Flegal KM, et al: Establishing a standard definition for child overweight and obesity worldwide: International survey. BMJ 2000; 320: 1240–1243
15) Kobayashi T, Fuse S, Sakamoto N, et al: Z Score Project Investigators: A new z score curve of the coronary arterial internal diameter using the lambda-mu-sigma method in a pediatric population. J Am Soc Echocardiogr 2016; 29: 794–801.e29
16) Lang RM, Badano LP, Mor-Avi V, et al: Recommendations for cardiac chamber quantification by echocardiography in adults: An update from the American Society of Echocardiography and the European Association of Cardiovascular Imaging. J Am Soc Echocardiogr 2015; 28: 1–39.e14
17) Arola A, Jokinen E, Ruuskanen O, et al: Epidemiology of idiopathic cardiomyopathies in children and adolescents: A nationwide study in Finland. Am J Epidemiol 1997; 146: 385–393
18) Nugent AW, Daubeney PE, Chondros P, et al: National Australian Childhood Cardiomyopathy Study: The epidemiology of childhood cardiomyopathy in Australia. N Engl J Med 2003; 348: 1639–1646
19) Lipshultz SE, Sleeper LA, Towbin JA, et al: The incidence of pediatric cardiomyopathy in two regions of the United States. N Engl J Med 2003; 348: 1647–1655
20) Colan SD, Lipshultz SE, Lowe AM, et al: Epidemiology and cause-specific outcome of hypertrophic cardiomyopathy in children: Findings from the Pediatric Cardiomyopathy Registry. Circulation 2007; 115: 773–781
21) Hazeki D, Yoshinaga M, Takahashi H, et al: Cutoffs for screening prolonged QT intervals from Fridericia’s formula in children and adolescents. Circ J 2010; 74: 1663–1669
22) Haycock GB, Schwartz GJ, Wisotsky DH: Geometric method for measuring body surface area: A height-weight formula validated in infants, children, and adults. J Pediatr 1978; 93: 62–66
23) DuBois D, DuBois EF: A formula to estimate the approximate surface area if height and weight be known. Arch Intern Med (Chic) 1916; 17: 863–871
24) Fujimoto S, Watanabe T, Sakamoto A, et al: Studies on the physical surface area of Japanese. 18. Calculation formulas in three stages over all ages. Nihon Eiseigaku Zasshi 1968; 23: 443–450
25) Lopez L, Colan S, Stylianou M, et al: Pediatric Heart Network Investigators*: Relationship of echocardiographic Z Scores adjusted for body surface area to age, sex, race, and ethnicity: The Pediatric Heart Network Normal Echocardiogram Database. Circ Cardiovasc Imaging 2017; 10: e006979
26) Kampmann C, Wiethoff CM, Wenzel A, et al: Normal values of M mode echocardiographic measurements of more than 2000 healthy infants and children in central Europe. Br Heart J 2000; 83: 667–672
27) Pettersen MD, Du W, Skeens ME, et al: Regression equations for calculation of z scores of cardiac structures in a large cohort of healthy infants, children, and adolescents: An echocardiographic study. J Am Soc Echocardiogr 2008; 21: 922–934
28) Wang SS, Hong WJ, Zhang YQ, et al: Regression equations for calculation of z scores for echocardiographic measurements of left heart structures in healthy Han Chinese children. J Clin Ultrasound 2018; 46: 328–333
29) Huwez FU, Houston AB, Watson J, et al: Age and body surface area related normal upper and lower limits of M mode echocardiographic measurements and left ventricular volume and mass from infancy to early adulthood. Heart 1994; 72: 276–280
30) Majonga ED, Rehman AM, McHugh G, et al: Echocardiographic reference ranges in older children and adolescents in sub-Saharan Africa. Int J Cardiol 2017; 248: 409–413
31) Gokhroo RK, Anantharaj A, Bisht D, et al: A pediatric echocardiographic Z-score nomogram for a developing country: Indian pediatric echocardiography study: The Z-score. Ann Pediatr Cardiol 2017; 10: 31–38
32) Jinguji H, Ayusawa M, Ohira K, et al: The examining of the fiducially point and reporting both the heart functions and measurement values based on physique of growth phase. Jpn J Med Ultrasound Technol 2004; 29: 486–492 (in Japanese)
33) Landon G, Denjoy I, Clero E, et al: Reference values of electrographic and cardiac ultrasound parameters in Russian healthy children and adolescents. Sci Rep 2021; 11: 2916
34) Daimon M, Watanabe H, Abe Y, et al: JAMP Study Investigators: Normal values of echocardiographic parameters in relation to age in a healthy Japanese population: The JAMP study. Circ J 2008; 72: 1859–1866
35) Kitaoka H, Tsutsui H, Kubo T, et al: Japanese Circulation Society Joint Working Group: JCS/JHFS 2018 Guideline on the Diagnosis and Treatment of Cardiomyopathies. Circ J 2021; 85: 1590–1689
 1,2,Eiki Nishihara3,Tadayoshi Hata4,Katsumi Abe5,Kunio Ohta6,Sigeru Tateno7,Yuichi Nomura8,Hitoshi Horigome9,Keiichi Hirono10,Mari Iwamoto11,Daisuke Hazeki12,Seiichi Sato13,Yumiko Ninomiya1,Yuji Tanaka1,Kenji Kuraishi3,Kazuyoshi Saito4,Naomi Izumida14,Hidenori Iwasaki6,Fumie Takechi15,16,Shouji Matsushima17,Hiroyuki Tsutsui17,18,Hiromitsu Ogata19,Hideto Takahashi20,Nobuo Tauchi21,Masami Nagashima21Masao Yoshinaga